
Image Credit: Building Science Corporation
More Building Science


One of the fundamental principles of building science is that buildings must be suited to their climate. When they’re not, problems can ensue. Maybe it’s just that they’re not as efficient as they should be. Maybe it’s worse. Put plastic between the drywall and framing of your exterior walls in Ottawa, and it can help control vapor drive from the interior air and its associated moisture problems (rare in all but except in extremely cold climates). Put that plastic in the same place in Georgia, and you’re going to rot the walls.
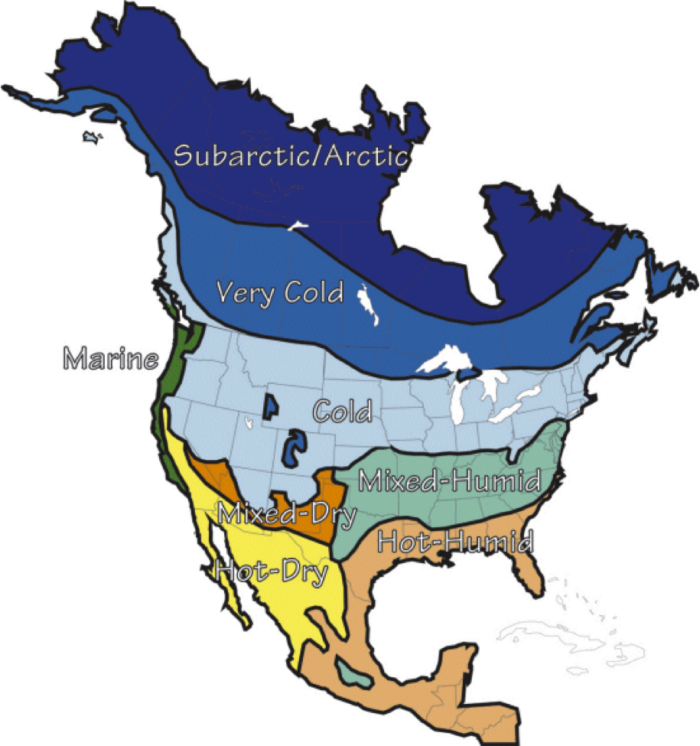
The first thing to know about climate zones is that we divide them up based on two parameters: temperature and moisture. The map at the top of this article, from Building Science Corporation, is one that seems to be in a lot of the curricula for home energy rater and other energy auditor classes. The fancy word for this type of division is hygrothermal, and Building Science Corp. has a nice interactive map of hygrothermal regions.
The map above divides all of North America into broad regions based on temperature and then humidity. My friend and former colleague Mike Barcik likes to say that the color of the zone shows what color your skin turns in winter.
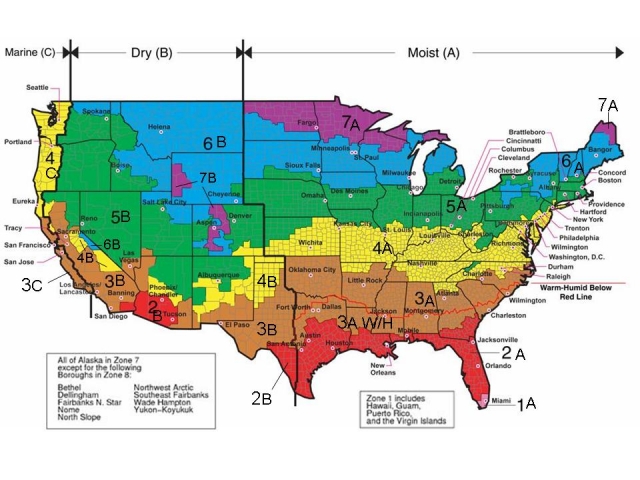
The International Code Council has a more fine-grained approach to climate zones,†as shown below in the map of the US from the International Energy Conservation Code (IECC). Each zone has a number, starting with 1 for the hottest US climate, the southernmost tip of Florida, and going up to 8, the coldest parts in Alaska.
Temperature divisions
The number of each zone tells you how warm or cold it is. I wrote above that temperature is the parameter, but that’s not a full description, of course. It’s not just how cold or how hot the place gets. It’s based on accumulated temperature calculations called degree days. Basically, degree days combine the amount of time and the temperature difference below some base temperature.
For example, the most common base temperature for heating is 65° F. If the temperature stays at 55° F for 24 hours, you’ve just accumulated 10 heating degree days (HDD). It’s the same for cooling degree days (CDD). The IECC uses 50° F for the cooling base temperature, so if the temperature is 90° F for 24 hours, you’ve got 40 CDD. For heating and cooling, you add up the total number of HDD or CDD for the whole year, and that tells you how hot, cold, or mild the climate is. (A great source of data for degree days is the degreedays.net website. Check it out.)
_0.preview.jpg)
The table above shows how the IECC uses the number of cooling degree days for climate zones 1 through 4 and the number of heating degree days for climate zones 3 through 8. In zones 1 and 2, cooling is the only important factor. In zones 3 and 4, it’s heating and cooling. In zones 5 and higher, it’s all about heating. Atlanta has about 3000 HDD (in “those annoying imperial units”) and is in climate zone 3.
Moisture divisions
Notice that the IECC map also shows how moisture impacts the climate zones. Generally, it’s moist to the east, dry to the west, and marine along the West Coast. I remember driving across Texas, from west to east, in the summer of ’88 and feeling the humidity hit us when we crossed that black line. At the time I had no idea what that big black line was when we drove over it, but now it’s clear.
People have known about that line since the 19th century, as a matter of fact. It lies pretty close to the 100th meridian of longitude, and divides the part of the US that gets enough rain to farm without irrigation from the dry side that requires irrigation.
The three main moisture divisions are:
- Moist (A). This is designated by the letter A after the climate zone number. Here in Atlanta, we’re in climate zone 3A. The primary factor is precipitation. If it doesn’t meet the dry climate definition below, it may be moist. The other necessary condition is that it’s got to fall outside the marine climate conditions.
- Dry (B). This is based on the amount of precipitation and the annual mean temperature. The calculation is 0.44 x (TF – 19.5), where TF is the annual mean temperature in degrees Fahrenheit. If the annual precipitation is less than the number you get, it’s a dry climate and the zone number has a B after it. El Paso, Texas, for example, is in climate zone 3B.
- Marine (C). This is the Goldilocks climate, in a way. It’s not too hot in the summer (warmest month mean temperature < 72° F), not too cold or too warm in winter (between 27 and 65° F), has at least four months with mean temperatures above 50° F, and has its dry season in the summer. We’re talking Santa Barbara (3C), Portland (4C), and Seattle (4C).
Actually, there’s a 4th moisture division shown on the map. Notice the red line going horizontally across the Southeast. It divides the eastern, moist side of the US into moist and moister, basically. This division isn’t based on precipitation, though. It’s based on humidity. A climate zone is called warm-humid if the wet bulb temperature is:
- ≥ 67° F for 3000 hours or more
- ≥ 73° F for 1500 hours or more
It’s all in the IECC
Wherever you read building science, you’re likely to run into someone talking about climate zones. Here on GBA, sometimes you’ll see commenters putting a number after their name in the comments—and not just nutty guys like me who always put a number after their name. They’re indicating their climate zone because it often colors how we think about buildings.
If you don’t know the exact definitions, it can be a bit confusing. Now you’ve got my summary here, but you can always get yourself a copy of the IECC as well. Most states are still on the 2009 version. Maryland and Illinois have moved up to the tougher 2012 already. The climate zone definitions are the same in both versions. In addition to the basic definitions above, the IECC also tells you county-by-county what the local climate zone is.
Now get out there and design, build, and renovate in ways that work for your climate.
†The International Code Council is based in the US and, like the World Series, has little foothold outside our borders. Although the IECC climate zone map here shows only the U.S., you can use the definitions of the climate zones for any location in the world.
For example, most of Canada is in climate zone 750. Just kidding. Most Canadians probably live in climate zones 5 and 6. By looking up heating degree days on degreedays.net, I found the following: Climate Zone 4C – Vancouver; CZ 5A – Toronto; CZ 6A – Ottawa, Montreal, Quebec; CZ 7B – Calgary. (Thanks to commenter Christopher Solar of Ottawa for straightening me out on this.)
Allison Bailes of Decatur, Georgia, is a speaker, writer, energy consultant, RESNET-certified trainer, and the author of the Energy Vanguard Blog. You can follow him on Twitter at @EnergyVanguard.
Weekly Newsletter
Get building science and energy efficiency advice, plus special offers, in your inbox.


18 Comments
Great Info!
Allison - great info here. I was just having a discussion with one of my customers yesterday on HDD and I obviously have some things to learn. Perfect timing for me. Thanks!
mark
Not _quite_ that cold in Canada
"Most Canadians probably live in climate zones 7 and 8."
Well, according to the data at degreedays.net, Toronto is in Zone 5 (~6700HDD) and Ottawa (where I live) is in Zone 6 (~7900HDD). I'd say that most Canadians live in those two zones.
Remember that most of us are huddled along our southern border (for warmth).
Chris.
Worth the price of admission!!!
Great article!!!! Easily worth the monthly charge for just this article. Love this site!!
Response to Christopher Solar
Oops. Sorry about that. I threw that in there without even doing my homework and will change the article as soon as I finish this comment. Thanks for calling me on that.
Finer-grained map needed?
It is a good article, worth repeating though that the US climate zone map is a very broad brush that places White Plains NY, Durham NC, and Wichita KS under the same rubric. Not so much in the real world!
Response to James Morgan
Yes, that's an excellent point. When we teach our HERS rater classes, we always have to emphasize the importance of picking the location that's in the correct climate zone, even if it's not the most similar climate. For example, Hilton Head, SC is very close to Savannah, GA, much closer than it is to Charleston. But the Savannah River separates CZ 2, which Savannah is in, from CZ 3, where Hilton Head is. (This comes into play with HERS ratings because the HERS Index is based on energy codes, which vary by climate zone.)
Response to James Morgan
James,
Remember Chapter 3 of the 2000 IECC? Before code simplification?
Back in those days, the code had 52 pages of maps and tables to help builders and designers figure out what zone they were in. Alabama had 5 climate zones; Alaska had 5 climate zones; and California had 13 climate zones. That was "finer grained," all right -- but the code was so confusing, so poorly implemented, and so poorly enforced that the DOE decided that code simplification, in spite of all its disadvantages, was a vast improvement over the old code.
Response to Martin
Yes, a simpler code might make for a simpler life, just so long as we remember the zones are mostly useful as a starting point and not the final answer. Those on the edges of the zones especially do well not to rely on solely on averages across a wide geographic and climatological swathe. I do most of my work at the very southern edge of Zone 4 but I'm less than forty miles from Zone 3 locations which actually have higher HDD and lower CDD numbers, so I know I need to tune my cooling strategies accordingly.
Enclosures That Work
Allison, The Building Science site has a section on Enclosures That Work, which provides guidance on home construction in each of the climate zones, except Marine, which is where I live. Those documents look like they were developed in 2009. Has then been something written specific to Marine areas since then? Is there a document you might recommend for Marine area construction?
Many thanks
Response to Christa Campbell
I'm not really up on what's going on in marine climate recommendations, Christa, but I can point you to a couple of organizations that may be able to help:
Ecotope in Seattle
Earth Advantage Institute in Portland, OR
Indeed a Nice Summary but?
The chart seems out of date if one looks at the table. I wonder when the chart was last revised/updated. Do you know? When one thinks about it the chart is being used as a baseline for decision on what to build now for a building/structure that will have a lifetime of 30-50 years. The chart should thus be forecasting the next 50 years expected weather in North America. This chart looks out of date (i.e. was developed in the 60's and has not been updated with current information and forecasts.). We now know that (through global warming) that the HDD will be much different than was predicted in the 60's - Western NA warmer and Eastern NA colder. The development of population was also less understood back then and the granularity required to accurately reflect the population growth (more buildings) does not reflect the considerable growth in the sunbelt and the coastline. Examples in my backyard. By current (last few years HDD) data Vancouver, Seattle and Portland (say 80% of the population north of California and east of the Cascades) should be a separate zone from east of the Cascades (below say 3000 ft elevation) and should be a 3C zone. I suspect that if these areas were classified as 3C then decisions made by the Building Code authorities regarding appropriate energy conservation methods would be different. I suspect that the same would apply to other areas in NA - insufficient granularity and poor prediction of future HDD and CDD.
Is this chart updated regularly?
Response to Keith Richardson
Keith,
You wrote, "This chart looks out of date (i.e. was developed in the 60's and has not been updated with current information)."
You're wrong. The DOE climate zone map was developed and proposed in 2002 by Ron Majette and Craig Conner. While you complain that the climate zone map doesn't make fine distinctions between climate zones, that was the deliberate intent. Reporting on the new map in a December 2002 article, I wrote, "The proposal would whittle down the IECC’s existing 19 climate zones to a mere eight zones. The proposed zone map is touted as an improvement, since it corrects for poor representation of cooling issues in the current IECC zone system. “The existing zones are based entirely on heating degree-days, which means they do a rather poor job of distinguishing climate factors that affect cooling loads,” notes the DOE’s informational Web page describing the proposal. “The new zones better reflect factors that impact cooling, such as cooling degree days, high wet-bulb temperatures, and variations in solar radiation.”"
It's always possible to make further subdivisions, increasing the number of climate zones to any number you want -- even 19 may not be enough. Maybe 50 would be better. However, the entire point of the revolutionary code reform movement that this map was part of was to simplify the existing code, which was rarely enforced, in hopes that a simpler code might usher in a new era -- one in which the code was able to be understood by builders, implemented by builders, and actually enforced by local code officials.
According to this chart, I'm in 3C. According to the California Climate Zone Map, I'm in 6.
https://ww2.energy.ca.gov/maps/renewable/building_climate_zones.html
This is a bit confusing, and which system do I use when looking up what sort of insulation requirements I have for my area? Zip code 92627 (Orange County, CA).
Allison's link to the IECC is broken. A good link to the 2018 IECC volume: https://shop.iccsafe.org/codes/2018-international-codes-and-references/2018-international-energy-conservation-code/2018-ieccr-code-and-commentary-1.html
It costs a fortune. I'm surprised that these things aren't public domain.
BlueSolar, the building code IS available at no charge: https://codes.iccsafe.org/content/IRC2018. You just have to pay if you want to read the commentary. The commentary provides information about context and intent, but it's not required reading.
That's the IRC. Is there a way to view the IECC? From what I can tell, it's paid access only.
Oh, sorry--here you go: https://codes.iccsafe.org/content/IECC2018P3. It's not the easiest site to navigate. (Chapter 11 of the IRC is basically a copy of the residential IECC.)
Thanks!
Log in or create an account to post a comment.
Sign up Log in