
More Building Science


For over 2,000 locations across the country, there are hourly weather data files packed with temperature, humidity, and wind information that can be used to better match home designs to the conditions they will face. But to say that all this information is dense and overwhelming is a bit of an understatement.
When I teach the Building Envelope course for the Boston Architectural College’s on-line Sustainable Design Certificate program, I always seem to be stringing together a bunch of different web sites for nationwide climate and weather data. But then I came across the free software, Climate Consultant 4 (CC4)1. It’s an amazing tool. It takes all that weather data and serves it up in 17 different charts, all of which are clear and compelling visual expressions of the data. Here are some of my favorites.
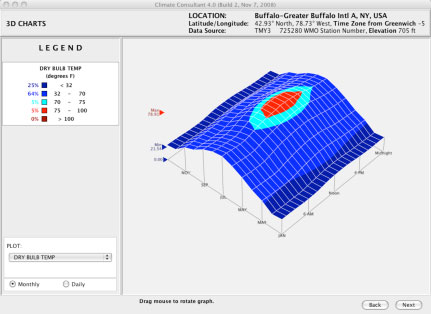
3-D Charts
Note how the colors categorize ranges of air temperature and how you can use the mouse to rotate the image to think the pattern through from different angles. It’s pretty easy to get a sense of temperature patterns with the data expressed in this 3-D chart.
The drop down menu under “Plot” allows you to use the 3-D chart for seven other weather parameters, like relative humidity and wind speed.
Wind Wheel
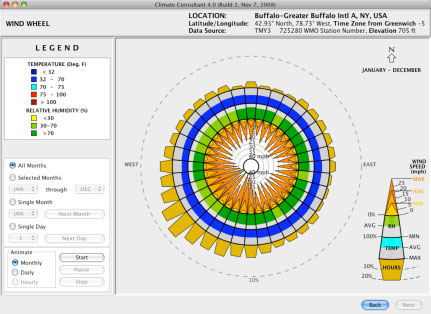
Wind Wheel 3-D Chart from Climate Consultant 4 showing patterns of direction, intensity, and duration.
The wind wheel can be useful in planning natural ventilation, landscaping, and orientation of entries and tall gables. You can change fields, including month selection, and even a time-lapse expression of all the wind data, at the lower left.
Psychrometric Chart
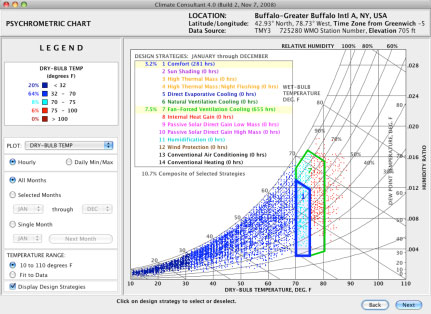
This psychrometric chart allows you to select different design strategies and see their relevance based on temperature and relative humidity impact on thermal comfort.
I think the psychrometric chart is the most useful chart you can generate with CC4
(there is also a great, short tutorial on psychrometric chart basics that you can download here).
The blue dots strewn across the chart are all of the hourly temperature/relative humidity data points for one year. The dots inside just the dark blue box meet standard thermal comfort conditions (per ASHRAE Standard 55). So in Buffalo, for example, there are only 281 hours a year when most folks would not need any form of space conditioning; the outside conditions alone would work.
The green box shows that the design strategy of fan-forced ventilation cooling would add another 655 hours of thermal comfort in Buffalo. You can work your way through all of the strategies, evaluating their individual and cumulative effects on thermal comfort.
And as you go, you can check on prioritized design guidelines that match the strategies you have selected on the psychrometric chart. The first design guideline listed for the psychrometric chart above is #42, recommending the use of ceiling fans.
Ceiling Fan Schematic
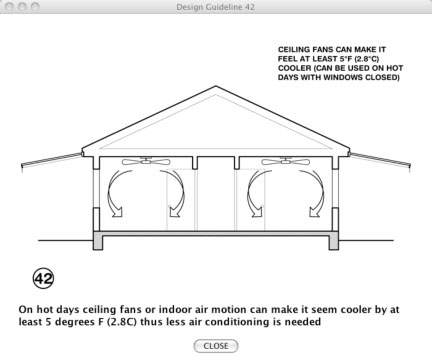
With the text for each design guideline in CC4 comes a schematic or drawing of the guideline.
Check out CC4 using either sample data weather files or go to EnergyPlus to download the weather file that is closest to your next project. It will either be a pretty good double check on your design or result in some great changes.
……………….
1 Climate Consultant was developed by the UCLA Energy Design Group and is copyrighted by the Regents of the University of California.
Weekly Newsletter
Get building science and energy efficiency advice, plus special offers, in your inbox.


7 Comments
Weather Data
Peter, I think you forgot the link
http://www.aud.ucla.edu/energy-design-tools/
Climate Consultant 4 is very interesting...thanks for the tip.
Here is another good weather site that I have been going to
http://www.wunderground.com/history/airport/KDFW/2009/5/7/CustomHistory.html?dayend=11&monthend=5&yearend=2009&req_city=NA&req_state=NA&req_statename=NA
You can enter your city and almost any time period.
Weather Data
Thanks John - I actually left out several hyperlinks--good catch. And thanks for the wunderground lead--great find.
A VeryGood Software
A VeryGood Software
Thank you - an outstanding resource
Thanks Peter and John,
I'm going to try to attend some hands-on workshops for HEED and Cliamte Consultant 4 when I'm back in the US. They look like good tools.
Climate Consultant 4
Hey John / Peter
Thanks for the interesting and useful information. May I have the link to download Climate Consultant 4. Thanks.
Downloading CC4 (now CC5!!)
Hi Kaluvan -
To download CC4 (or the new CC5), you just hover over the text "Climate Consultant 4" in the 1st paragraph in the blog above, and then when the "hand" appears, click on it. Then you need to scroll down through the various tools available on this site (http://www.energy-design-tools.aud.ucla.edu/) until you see the download available (one for PCs, and one for Macs).
I just downloaded the newest version, CC5, but have not yet really explored it. Give it a try.
Is this possible to put the
Is this possible to put the weather data manually in climate consultant?
Log in or create an account to post a comment.
Sign up Log in