
Image Credit: John Proctor, Rick Chitwood, and Bruce Wilcox
Image Credit: John Proctor, Rick Chitwood, and Bruce Wilcox Variation in HERS Index, heating consumption, and cooling consumption for 24 HERS ratings in the Stockton, California study.
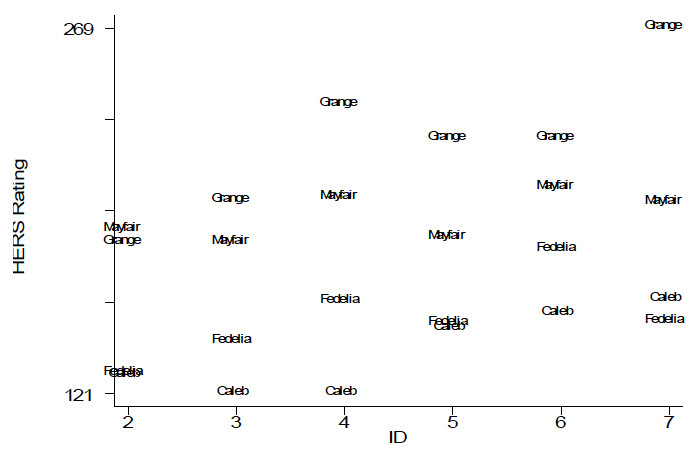
Image Credit: John Proctor, Rick Chitwood, and Bruce Wilcox HERS Index by home and by rater in the Stockton study.
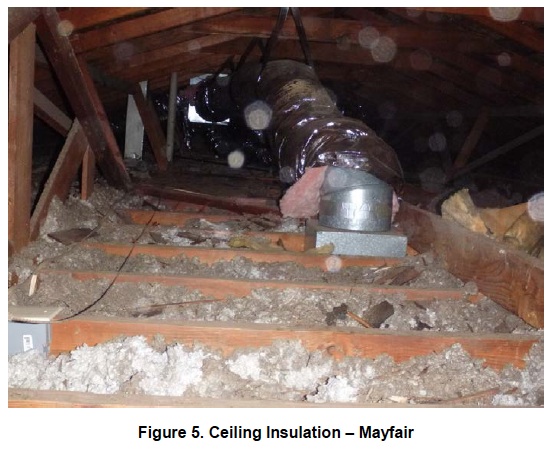
Image Credit: John Proctor, Rick Chitwood, and Bruce Wilcox The attic insulation levels reported by the six raters varied significantly. The home shown here had about 1 inch of insulation with an R-value of 3 or 4, yet three of the six raters reported it as having R-11.
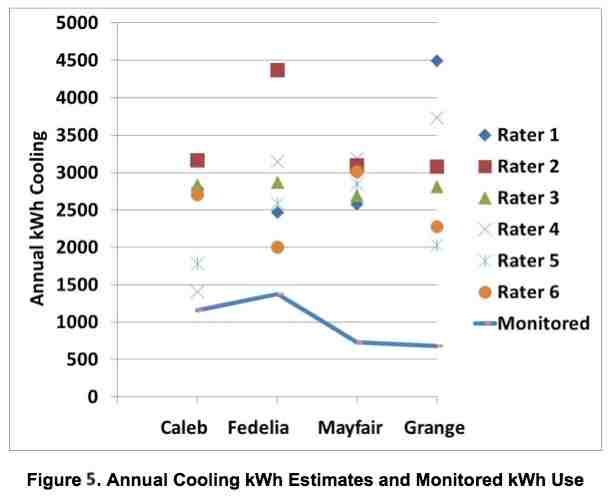
Image Credit: John Proctor, Rick Chitwood, and Bruce Wilcox Cooling energy use by home varied significantly among raters, but even the home with the smallest variation still differed greatly from the monitored cooling energy use.
Image Credit: John Proctor, Rick Chitwood, and Bruce Wilcox Accuracy vs. precision. The four shots on this target are precise since they all hit close to one another. They are not accurate, however, as they did not hit the bull's eye. Most of the rating results in this study show both poor precision and poor accuracy.
Image Credit: Wikimedia Commons, public domain
More Building Science


A home energy rating is supposed to tell you how energy-efficient your home is. A certified home energy rater goes to the home and collects all the data relevant to energy consumption in the home (well, all the data included in the rating anyway, which is almost everything). Then he or she enters the data into energy modeling software and get the results: consumption for heating, cooling, water heating, lights, and appliances, plus this thing called a HERS Index. But what if the results were off by 50%, 100%, or even more?
That’s exactly what a new study in California has found. In the same project I wrote about earlier this year (Stockton Project Demonstrates Huge Home Energy Savings), researchers John Proctor, Rick Chitwood, and Bruce Wilcox hired 6 California HERS raters to rate the four homes in the study. Here’s a quick description of the homes:
| House | Year Built | Size |
| Caleb | 2005 | 2076 sf |
| Fidelia | 1990 | 1690 sf |
| Mayfair | 1953 | 1104 sf |
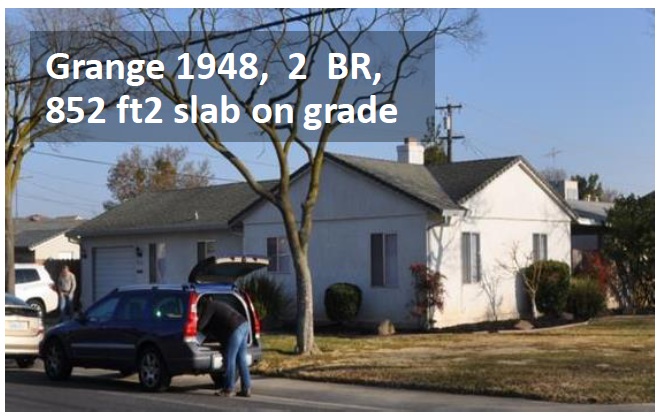
| Grange | 1948 | 852 sf |
The envelope, please
The study, titled Round Robin HERS Ratings of Four California Homes: A Central Valley Research Homes Project, was published in May 2014 and shows the data from the raters they hired to rate each home. And who did those ratings? Before they did any work on the homes, the researchers hired 6 raters: 5 certified HERS raters using the California HERS protocols and one independent rater. All used the energy modeling software Energy Pro version 5.1.6.7.
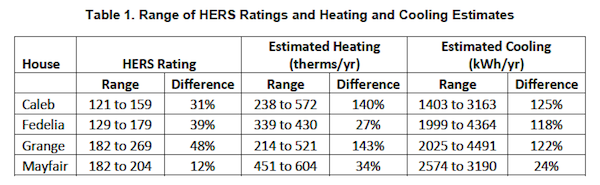
The summary table of the main results (Table 1) is shown as Image #2, below.
The second and third columns, labeled HERS Rating, show the range of HERS Index values calculated by the six raters and the percent difference between the highest and lowest. Only one of the homes (Mayfair) comes close to having an acceptable variation among raters. Even that 12%, however, is four times as much as RESNET allows in the field QA process for raters. The heating and cooling consumption are also shown, and the spread is even worse.
Image #3 (below) is a graph that shows each rater’s HERS Indices for the four houses. The vertical scale is the Index and the horizontal scale shows the raters by ID numbers. The Grange and Mayfair homes, being the two oldest, have the highest HERS Indices for all six raters with the Grange being the highest of all four homes for five of the six raters.
Why so much variation?
Strangely, the smallest, simplest house had the most HERS Index variation among the six raters. The home the researchers called the Grange, shown in the photo at the beginning of this article, has only 852 square feet of conditioned floor area. It also has the simplest type of foundation to enter (slab on grade) and none of the complicating factors like attic kneewalls, vaulted ceilings, or sealed attics that can make some houses difficult to rate. It’s just a simple, little box.
Despite the simplicity, however, the HERS Index for this home ranged from a low of 182 to a high of 269, a difference of 48%. One of the problems seems to have been the raters’ inability to agree on the efficiency of the air conditioner. The six raters used SEER ratings of 8, 10, 11, and 12, a difference of 50%.
Another problem with accuracy was attic insulation. The researchers reported that the Mayfair, the second smallest and oldest of the homes, had an average of about one inch of insulation on top of the ceiling, as shown in the photo below. That would result in an R-value of about 3 or 4, yet three of the HERS raters entered that ceiling as being insulated to R-11. In the Fidelia home, the ceiling insulation entries varied from R-19 to R-49.
Accuracy versus precision
In their initial report on the HERS ratings, the researchers did not include a comparison of the raters’ results to the measured results from the study. This is a three-year project in which the researchers started off with a baseline analysis of the homes, including these HERS ratings, and the proceeding through various improvements. Before making any improvements, however, they simulated occupancy of the homes and measured the energy consumption.
Image #5 below is a graph that shows the spread in the estimated cooling energy use for the four homes as calculated by the energy modeling of the six raters and the monitored energy use with simulated occupancy. As you can see, the raters’ numbers were significantly higher than the monitored results in nearly every case.
One interesting thing to notice here is that for the Mayfair, the raters had pretty good agreement. As shown in Image #2 below (Table 1), their results differed from one another by a maximum of 24%. The mean of their six results is 2,903 kWh. The measured result for cooling energy use is 731 kWh. I could tell you how many standard deviations of the mean separate the results (22), but the bull’s eye graphic below shows what it means to be precise but not accurate. For that illustration to be numerically correct, though, the cluster of shots would have to be much farther from the bull’s eye.
California HERS ratings
HERS ratings in California are not in the purview of RESNET, the nonprofit organization that oversees HERS ratings in most of the country. The state oversees the work of HERS raters there. The California guidelines are similar to RESNET’s, with the same basic structure and quality assurance requirements. The California Energy Commission has a web page on their HERS program, with links to their regulations, technical manual, and more.
Are HERS ratings worthless?
It’s certainly tempting to think that HERS ratings are a waste of money when you see how imprecise and inaccurate these ratings are. After all, if the six raters here can differ so much from one another and from the measured results, that doesn’t engender a lot of confidence in the process.
Even though California’s rating process is separate from RESNET’s, it’s structured similarly, so two factors are probably most responsible for the discrepancies the researchers found in this study. One is that a HERS rating is an asset label. It’s not meant to align perfectly with actual energy use because it’s designed as a way to help you compare one house to another without the differences that arise from the way people live in their homes.
The other factor is quality assurance (QA). I wrote about this recently because RESNET is going through the process of trying to get greater consistency in HERS ratings (and unfortunately trying to go down the wrong road).
My company, Energy Vanguard, is a HERS provider, and I think we do a pretty good job with QA. We train our raters well and don’t just automatically approve every file sent our way. Sometimes a rater will have to make corrections to a file three or four times before we approve it, and probably about half of the files we get need at least one correction.
But I think we go further than many. RESNET requires providers to check only 10% of all files, meaning 90% can get approved without anyone looking at them. And, as I wrote in my article about RESNET’s improvement efforts, RESNET has done little to no technical oversight of providers, so it’s not hard for bad ratings to get all the way through the process. I’m sure it’s not much different in California, and that’s why Proctor, Chitwood, and Wilcox found the results described here.
I think that home energy ratings are a useful tool. They’re not as good as they can be, however, and I think studies like this one can help expose the problems. Only then can we fix them.
Allison Bailes of Decatur, Georgia, is a speaker, writer, energy consultant, RESNET-certified trainer, and the author of the Energy Vanguard Blog. Check out his in-depth course, Mastering Building Science at Heatspring Learning Institute, and follow him on Twitter at @EnergyVanguard.
Weekly Newsletter
Get building science and energy efficiency advice, plus special offers, in your inbox.


11 Comments
So I guess....
we should just be using previous year's energy bills to rate a house envelope, rather than auditor scores?
RESNET - Seriously Flawed
If you want to see another flawed program, try using RESNET.
Conflict of interest with the raters?
I had a home energy audit done a couple years ago by a company in upstate NY who does HVAC, insulation and air sealing. I didn't really lead on that I knew much of anything about building construction or home energy use. The contractor did a very thorough job using the blower door test in conjunction with taking pictures using the thermal imaging camera to find air leaks. I got the idea they really knew what they were doing. The contractor then took some info on how much money I was spending to heat my house then came up with an estimate on some spray foam and a new condensing natural gas boiler. His cost benefit analysis showed me that I could reduce my annual heating bill by more than I actually spent annually on heating, and that if I decided go ahead with the job it would pay itself of in about 15 years. He must have thought I looked pretty dumb. I was mostly looking forward to using the TIC images but he never gave me them. I guess the moral of the story is there is a conflict of interest with the raters being the contractor. There will always be contractors who will prey on uneducated customers. I am not saying that all contractors are that way. I was actually partly having the audit done because I was interested in starting my own business that would offer insulation air sealing and wanted to get an idea of what other contractors were offering and for how much. I won't even go into the story about and window salesman.
Utility bills aren't perfect either (response to John Crocker )
Somebody who keeps it 60F during the heating season and 85F during the cooling season will have very different energy costs than somebody keeping it 72F in winter, 76F in summer (or 76F in winter, 68F in summer), or if they use auxiliary heating such as wood stoves that may not have accurate billing records. An unoccupied house only heated to 55F in winter and not cooled at all in summer doesn't us a much energy at all.
Occupant behavior is one of the least stable variables, and it has a large impact, which is why these rating systems attempt do do apples-to-apples assessments. But like any other calculation, if the data you put into is is garbage, so is the calculated result, as John Proctor et al were able to demonstrate.
That's not to say energy use history isn't a VERY useful set of data, but without the interior temperature (& weather history) that went along with it means it can't be taken at face value.
Ratings illusory w/o context of how home is configured and used
It takes boots-on-the-ground observation, interview skills and, potentially, sub-metering to properly discern how a building performs and how its users interact with it.
Recent client: "My home has a HERS score of 60 but I'm getting $160 electricity bills, and I didn't expect that!
Answer: "A twit with a clipboard absent deep experience isn't equipped to accurately assess a building's envelope, systems and all its interactions with its users."
Every case of unexpectedly high energy use has at least one smoking gun, be it horrible ductwork, poorly maintained HVAC, a 2 HP pool pump running 12 hours / day, a hot water plumbing leak, ridiculous outdoor water feature, a 25 year old side-by-side fridge with through door ice and water operating in a 100 degree garage...the list goes on, and I'm not sure all the various ratings programs capture much of that.
"You should have R38 attic insulation", yeah, maybe so...it'll save $25 per year over R19. Meanwhile the oversized pool pump is burning $1000 / year when it could be using just $150.
My response to an Architect and EE study Program manager
An architect asked my thoughts on this article (we've also completed an EE study here in Charlotte together). I figured I would post my response to get some others feedback on this important issue.
"The short answer is we're trying to solve a fundamental problem (demand side efficiency) by the lowest denominator solution: labeling. Just like Organic foods (will this solve health epidemics and has it truly increased our quality of food?), MPG stickers for cars or even Energy Star appliances labeling is only a beginning to changing a behavior. Energy Star appliances have seen stark differences in labeled and "field" performance,. While HERS ratings, which are supposed to be "more accurate" because of a third party model, are seeing the same variances. Why you ask? Its easy to say "low quality of work'. BUT, IMO energy prices haven't soared enough to make this hot topic and demand a higher level of deliverable from raters and inspectors alike. In cities like Austin, TX where HERS ratings for older homes are now REQUIRED, the common HERS rating price in my research is around $100. I charge $95 for a site visit to come and look at someones home. Am I greedy or just accurately compensating for my time and overhead? A HERS rating on an existing home may take 1.5-3.5 hours if you're performing testing. Calculate the hourly labor rate on this an you can see how difficult, on even a volume basis, it is to make a profit. Which is also part of the reason I'm getting out of this type of business all together. The market demand isn't high enough and we're trying to use policy to squeeze this in but the thing about public involvement, again in my opinion, is it lends itself to a lower price and subsequently a lower quality of work. There are a lot of people in this industry who have taken hard lumps in promises of a clean energy future, and come up extremely empty handed.
Don't take this as an attempt to say HERS ratings are not helping drive the pathway for a more EE economy because labeling, like Energy Star appliances, helps drive customer demand for a higher performing product. The truth is, like an industry, there is a ton of bureaucracy in the RESNET world right now. Volume is more important than quality in some aspects. It's a hard trade off for a blossoming industry. What you get, is what you see right here.
It begs a fundamental question too: Does labeling change behavior? Because that home received a HERS, has anyone done anything since they improved the homes efficiency? That is our goal, right? This is where companies like OPower have come into play. "
More uncertainty with "ordinary" construction?
I have to wonder if there is just inherently more uncertainty in rating houses that are either more recently constructed and just "to code" or much older construction. With a new, tight, well-insulated home, designed and built to be just that, everything about the construction is known, there are few components with much uncertainty in performance, and where there are uncertainties (eg. ground losses) the absolute number is small in the first place. On the other hand, with an existing home there is far more uncertainty about how well any of it was done; you can't see inside the walls. Different assumptions are going to be made by different raters, so perhaps widely varying results are simply to be expected. Thoughts?
disconcerting
Has RESNET done similar studies under their own jurisdiction? And if so what where the findings? This is definitely disconcerting, but a study of six raters and four homes in one area is not yet an entire picture of an industry.
Allison, you gave two examples of widely varied input data, that makes me curious if those were the worst cases, or was it all that varied? I suspect it is adherence to the protocols that is lacking, rather than the protocols themselves. Seems like age-based defaults on AC SEERS should have prevented four different assumptions there. (Although, not always easy even to find out what age it is...)
Would also agree that it seems more interesting to compare variations across age of housing, rather than size. Small gradations in R-value once you get above code minimums don't make as wild a difference to the energy model as the difference between R11 and R3. An old house is far more likely to have minimal-efficiency systems where variations in interpretation have a greater effect on the final outcome, at the same time the kind of stuff you see in old houses is more likely to require "interpretation" even if there exist strict protocols for that interpretation.
Response to Dillon Vautrin
I'm sorry to hear about the trouble you've had with a HERS rater you hired. You can do something about it, though, and I hope you will. First, you can file a complaint against the rater with the rater's provider. If that doesn't satisfy you, the next step would be to file a complaint with RESNET (http://www.resnet.us/complaint-resolution). They really take complaints seriously. Second, if the rater was working in a NYSERDA program, you can let them know about it, too.
On the conflict of interest issue, that's a tricky one. Sometimes companies that look like they're independent of one another aren't. Sometimes independent companies can still be influenced by the fear of losing jobs. RESNET allows raters to be involved in the work on a home, but every rating done is supposed to come with a disclosure form signed by the rater. Did you get one?
Response to Curt Kinder
Your pool example is a good one. Steve Easley in California said to me recently, "If you do an energy audit on a house with a pool, leave the blower door in the car. You can save more money on the pool."
Response to Matthew Ryan
You raise a lot of important points and questions. A lot of it depends on where you are and who are the players in your market, but you're right that HERS ratings have become a commodity in many places and it can be hard to make money on them. And I think your 1.5-3.5 hours isn't realistic for larger homes. When you get into houses with 3 systems, bonus rooms, and sealed attics, you can spend a full day collecting the data, doing the calculations, entering the data, and generating the reports.
Log in or create an account to post a comment.
Sign up Log in