

Image Credit: Peter Yost
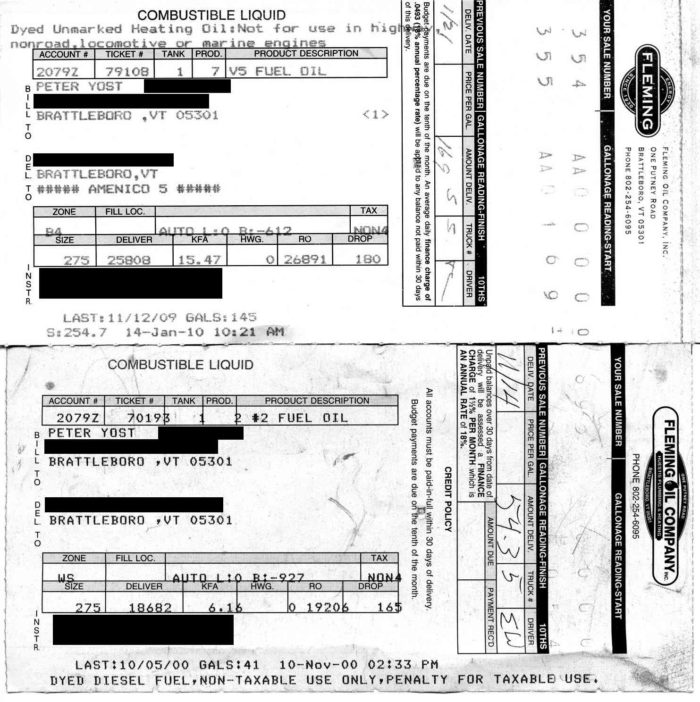
Image Credit: Peter Yost The top fuel ticket, from 2009, shows a "kfa" at Peter's house of 15.47 while the bottom ticket from 2000 shows a kfa of 6.16.
Image Credit: Peter Yost
More Energy Solutions


It turns out you can learn a thing or two from your fuel bill—and if you get fuel delivered, your delivery ticket.
But first, how cold a winter did you think it was? Or perhaps I should say, how cold has it been so far? I’m struggling to get a fire going this morning, and out my window there is two feet of snowpack still on the ground!
Most people I’ve talked to seem to feel that 2010–11 was a cold winter—a “real” winter. I had a feeling that while that may be true compared with recent years, and maybe in terms of snow, it wasn’t historically cold. So I decided to look at the weather data.
Let’s check the data
Let’s just look at January, the peak of the heating season. Residents of Brattleboro saw 1,397 heating degree days in January 2011. I’ll pause now for jargon identification.
Heating degree days, or HDD, tell us how cold it is relative to a baseline temperature, and are a useful measure of heating demand. To calculate HDD, take the average temperature for a given day, say 20 degrees Fahrenheit. Subtract that from a baseline temperature at which the need for heating would be minimal or none—usually 65 degrees Fahrenheit. Subtracting 20 from 65, we get 45 HDD for that day. There is also a similar measure of cooling degree days, or CDD, for hot weather.
(If, like me, you easily forget what an HDD is and how there can be so many of them in one calendar day, my advice is as follows. Cut out and tape the previous paragraph to your fridge. When you hear heating degree days mentioned on the weather radio or TV, check this handy reference!)
Not that cold a winter
Back to January 2011 and its 1,397 HDD. That was almost 100 more HDD than January 2010, making that a genuinely cold month, right? An extra 100 HDD is the equivalent of five days of the month spent at 5 degrees instead of 25 degrees, or about one week’s good cold snap.
However, over the last 25 years, the average HDD for January has been 1,377, so January 2011 isn’t quite so exceptional. December is also a similar story, but Fall 2010 is different.
September 2010 visited us with 242 HDD, which is balmy compared with a 25-year average of 320, or even with a five-year average of 266. When you factor in this warm fall into the decently cold winter, we are on track for a ho-hum 2010–2011 heating season of about 7,300 HDD. That looks mild compared with over 9,000 HDD in 2002, 1995, or 1982. In fact, on our current trend 30 of the last 35 winters will have been colder! These numbers are in Brattleboro, Vermont, but I’ve checked a couple other locations in the U.S. and the story seems similar in other populated areas.
Getting heat delivered when you need it
Who cares about this data? While most of the country has its heat piped in, either through gas lines, electric, or steam, it is common in the Northeast for heating oil trucks to fill our 275-gallon basement tanks.
If the heating company is delivering that oil on a contract basis to your home or business, it needs to know two things: how cold it has been, and how much fuel your home or business typically goes through. That’s where HDD data comes in, and thanks to Bob Dukeshire of Fleming Oil in Brattleboro for sharing his.
To know how much oil you go through, Dukeshire and other heating folks keep an eye on historical averages, using something called “K-factor.” This might show up as “kfa” on your fuel ticket, as it does for my colleague Peter Yost who offered a copy of his ticket for me to study. (See the image—the top fuel ticket, from 2009, shows a “kfa” of 15.47 while the bottom ticket from 2000 shows a kfa of 6.16.)
What’s your K-factor?
The K-factor is the number of HDD in a given period divided by the number of gallons of fuel oil you used in that period. This basically gives you a measure like miles-per-gallon, but for your house. Heating companies keep track of your home’s historical use to know your K-factor. By looking at that alongside HDD data, they can decide how much fuel to deliver, and when.
If you consume fuel in this way, you can use this measure to see just how much each HDD costs you. Peter’s house has a K-factor of 15.47. That means that for every 15.47 HDD, he will burn one gallon of fuel oil. Keep in mind that one calendar day could have anywhere from 5 to 75 or more heating degree days, so it adds up!
If we take a ho-hum five-year average of 7,323 HDD for a season, that means that Peter is likely to burn 473 gallons a year. As of January, the average nationwide heating fuel price was $3.52 per gallon (it has gone up since then), putting Peter’s 2010–11 heating cost at around $1,665. What if it were a truly cold winter, on the order of 1981 and its 9,517 HDD? Pete would be paying $2,233 at January 2011 prices.
Big payoff from weatherizing

The really interesting story about Peter’s fuel ticket is that since he bought the house in 2000 he did a very thorough job of weatherizing it. He added significant insulation to the exterior (including spray-foam as shown in the photo above), installing new siding, and more insulation in the basement and attic. He also added storm windows. He added a bit to his house size, with a home office and a mudroom, but he paid close attention to insulating and air-sealing these spaces. He also switched his domestic hot water from electric to oil, which adds to his consumption of heating oil.
While Peter’s K-factor today is 15.47, back in 2000 it was 6.16. If he hadn’t done those renovations, Peter would be paying $4,200 or more to heat that house today.
I asked Peter how he felt about saving $2,500 per year (at January 2011 prices) from his weatherization project. He first gave me a reality check about what it took to get those savings. He bought the house for $106,000, and then put about $120,000 into it—not just in weatherization but also in other upgrades like a larger kitchen, new wiring, new bathrooms, and more.
Peter is happy with how a recent appraisal matched up well with those figures, even thought the appraisal doesn’t reflect the value of the home’s strong energy performance. “We think it was a really smart investment,” he told me.
When scoring a perfect “10” isn’t enough
The U.S. Department of Energy’s Home Energy Score provides another way of looking at Peter’s home. Peter told me that his home would earn a perfect “10’ on the Home Energy Score scale, but that his home actually out-performs that score by 25 percent. While I give Peter a lot of credit for what he’s done, I have to wonder something. If he’s burning 500 gallons of oil a year (nothing to sneeze at) and his house is a perfect “10” on our government’s scale—I’ll put this in a way that “Spinal Tap” movie fans can appreciate—maybe that scale should go up to 11, at least.
By the way, Bob at Fleming says that he sees homes with K-factors anywhere from 3 to up in the 30s, but homes with scores so high typically supplement with wood or wood-pellet heat. He told me, “A newer mobile home or double-wide has a K-factor in the 12–14 range and uses about 350- 450 gallons a season.”
How much fuel do you burn—in K-factor or whatever other measure you track? And how do you feel about it? Please post your comments and questions below.
Tristan Roberts is Editorial Director at BuildingGreen, Inc., in Brattleboro, Vermont, which publishes information on green building solutions. You can learn more at www.BuildingGreen.com.
Weekly Newsletter
Get building science and energy efficiency advice, plus special offers, in your inbox.


3 Comments
MPG
I use a similar gauge, HDD per therm, I am a bit over 12 HDD per therm or 100,000 Btu's.
Too much Time for Ave. Joe
GBA does a great job of making these labor intensive process simple. Maybe I'm a lazy homer, but the Pacific Northwest has this MPG rating and a new auditor software tool to create jobs and give consumers an accurate mpg home rating. Energy-Performance-Score.com.
Hurray for shared walls
Converting my 111 CCF of heating natural gas for the 5 months of winter for which NOAA has HDD to gallons of oil, my apartment has an equivalent k of 80 :) The house isn't even insulated yet! By next winter, a heck of a lot of cellulose and spray foam will make it much more comfortable in here, but this shows that the shared walls in multifamily houses and "freezing in the dark" can really keep the heating bill in check.
Log in or create an account to post a comment.
Sign up Log in