
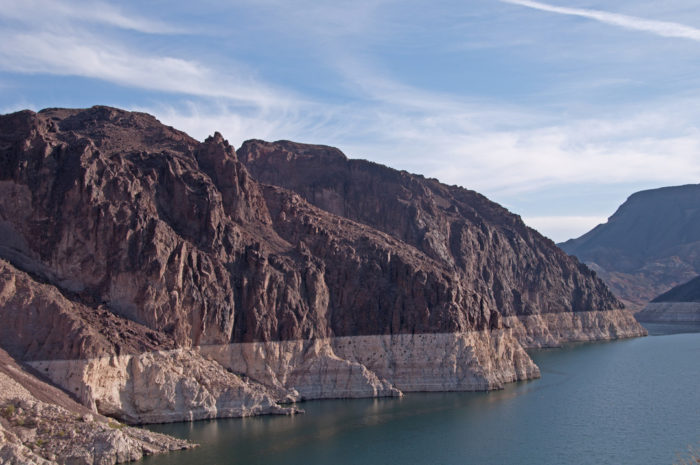
Image Credit: Deepti Hari / CC / Flickr
More Guest Blogs


A few large weather systems make all the difference between a wet and a dry year in the Southwest. Coming during the winter and spring, they account for the bulk of the rain and snow the region receives.
My colleagues and I were intrigued by the relationship between weather systems and rain and snowfall in the contiguous United States. We used historic weather data from the period 1979 to 2014 to find a representative set of weather types.
We found that during the last 35 years, weather systems that bring precipitation in the Southwest formed less and less often, indicating a drift into a drier climate state. Today, in other words, droughts can form more easily, last longer, and be more intense than a few decades ago.
Although we did not investigate the causes of this drier weather, it is consistent with what climate models predict. Our findings are also a window into a drier, more drought-prone Southwest U.S. in the future.
When rain-producing systems become scarce
Weather types can be thought of as patterns of wet and dry regions, much as one would see on a daily weather map.
We found that 12 weather types are sufficient to represent the variety of day-to-day weather in the Southwest. Among those, only three of these weather types bring large amounts of moisture while the other nine are predominantly dry.
In a nonchanging climate, the frequency of different weather types occurring varies from year to year (e.g., some years have more sunny days than others) but does not change over a period as long as 35 years.
To our surprise, we found in looking at historical weather data that the frequencies of the three weather types mainly responsible for rain and snow in the Southwest significantly decreased at a rate of 10% each decade. And they were replaced by weather types that have predominantly sunny weather.
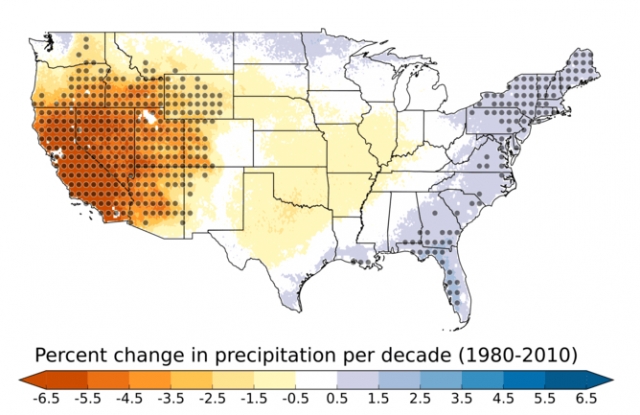
As a result, some regions of the Southwest lost 25% of their rainfall, particularly along the highly populated coast of California over the period 1980 to 2010.
Significant drying trends extended inland to Wyoming and Colorado. We also found an opposite, but much weaker signal of increasing rainfall due to shifts in weather types along the U.S. East Coast.
Detecting changes in rainfall is difficult because of the large differences in the year-to-year rainfall amounts. These swings can mask changes until the overall trend emerges above the noise. Our method of connecting changes in rainfall to the frequency of certain weather types extracts the signal from the noise and makes it possible to detect trends.
This early detection may provide insights into how the region should prepare for a future with drier weather. In addition, information like this can be included in climate adaptation measures such as the design of new water resource infrastructure for irrigation, hydropower, or drinking water supply.
The role of climate change
These observed changes are consistent with changes expected from climate change.
Climate models show that the subtropical dry zone, a region around 30° latitude, which includes most of the world’s major deserts, widens and expands toward the poles with future warming. Thirty degrees north is the approximate border region between the U.S. and Mexico.
In fact, this expansion has already started, resulting in a dry zone 2° to 5° farther northward into the Southwest U.S. since 1979. The expansion of this dry zone leads to an increase in high pressure systems over the northeast Pacific. The dominant high pressure inhibits the transition of low pressure systems into this region, which are responsible for most of the rainfall in the Southwest. The dominance of high pressure systems over the northeast Pacific was a main cause of the devastating recent drought in California.
Climate change is a plausible explanation for our results, but we did not investigate if the detected changes are caused by climate change; this was not possible with the available data. The next stage of the research will analyze climate model data to investigate simulated changes in weather types.
Whatever the causes, the implications of our results are far-reaching, since the Southwest is already the driest region in the U.S. and its population is rapidly expanding. Decreasing rainfall in this region puts additional stress on the already limited water resources.
At the same time, the Southwest is dealing with hotter weather on average. The steadily increasing temperatures of a warming climate cause enhanced drying of the soil due to stronger evaporation of soil moisture. The combined effect is a drastically increased potential for droughts in the Southwest.
All of this means that nowadays drought can be more intense, occur more often, and last longer than droughts in observed history.
Andreas Franz Prein is a post-doctoral researcher at the National Center for Atmospheric Research in Boulder, Colorado. This post originally appeared at The Conversation.
Weekly Newsletter
Get building science and energy efficiency advice, plus special offers, in your inbox.


2 Comments
Lake Mead
I've been told that it would take 6 years of above average rainfall to bring Lake Mead to full pool. It's a sad state of affairs out West with those ridiculous water rights.
Thanks
Thanks for the informative post. I especially like the map with the gray dots for statistical significance--great way to display the info.
Good luck to the west!
Log in or create an account to post a comment.
Sign up Log in