

More Guest Blogs


As California’s policymakers celebrate SB100, a landmark bill that requires utilities to deliver carbon-free electricity by 2045, the details on how this will be delivered are yet to be disclosed.
Buildings in California currently use electricity for approximately 48% of their total energy demand. The remaining 52% leans heavily on carbon-intensive sources such as propane and natural gas. Organizations such as the American Council for an Energy-Efficient Economy (ACEEE) have noted that California “must go big on energy efficiency to be carbon-free by 2045.”[1] This means that despite a building energy code that is widely admired and stricter than many other states, we’ll need to wring much more efficiency out of our buildings. But can this be done? And how much room for improvement is there?
In February of 2018, the City of Palo Alto released a ground-breaking report, innocuously titled: “Buildings Baseline Study and Roadmap for Zero Net Energy Buildings.”[2] This report, while attempting to adhere to the state’s previously mandated zero net energy (ZNE) goals, inadvertently exposed a more urgent priority for buildings.
The release of Palo Alto’s report arrived barely a month prior to the California Energy Commissions’ (CEC) announcement of its proposed updates to the 2019 Title 24 Energy Efficiency Standards.[3] This CEC announcement made headlines nationally due to a new requirement to include solar panels for all residential buildings by 2020. However, more significant than the bling of the required PV was a careful walk-back from an earlier push towards zero net energy buildings.
The CEC’s deft side-stepping of its previous ZNE targets was easy to miss as it was mentioned only at the very end of the FAQ,[4] camouflaged under the subtitle “Do the 2019 residential standards get us to zero net energy?”
There’s much to unpack in these two documents, which serendipitously serve to reinforce and clarify each other. In order to further clarify them, we’ll measure them against the energy models of a cluster of seven recent Palo Alto projects. These will be used to explore where the CEC could potentially take residential code updates in the future and illustrate just how much wiggle room remains to increase residential building efficiency. We’ll close with the sobering reality of the measured performance data for a project similar to those we’ll review in Palo Alto. Our goal is to support the CEC’s pivot towards building decarbonization and point out where they could potentially take California’s energy codes in the near future.
Learning from Palo Alto
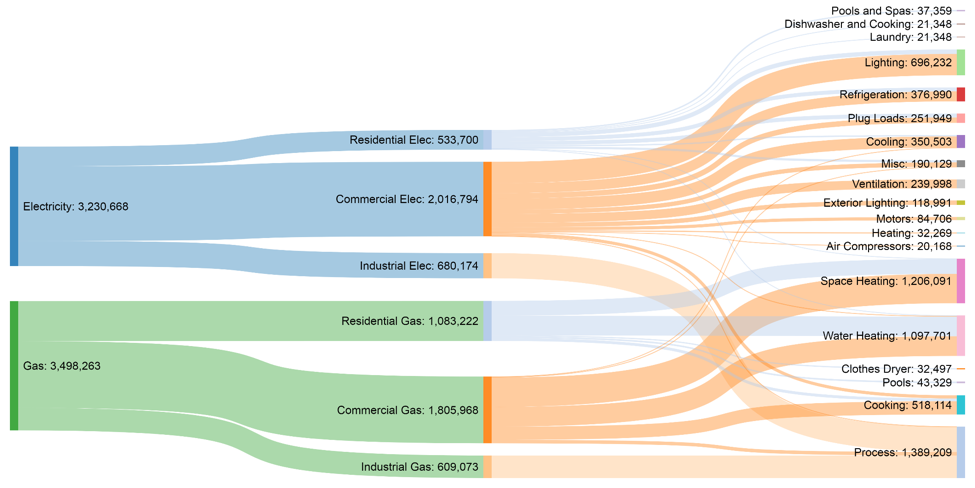
Palo Alto enjoys the good fortune of having a municipally owned utility, which was able to provide energy use data for this study. Its report begins with a great Sankey diagram (below) illustrating overall source energy use that aligns with much of the State of California. It leans heavily on natural gas and accounts for just over half of total energy use.
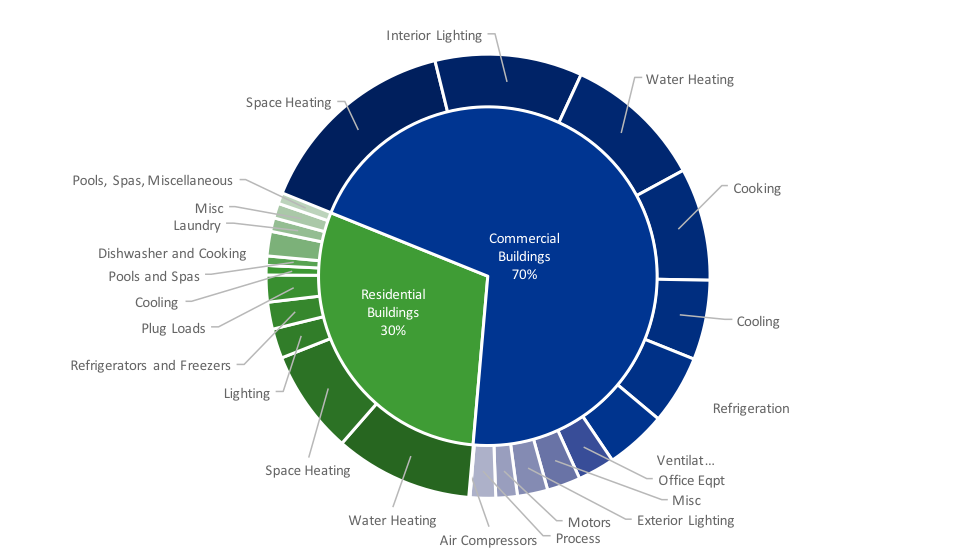
The next pie graph shows a total energy use breakdown similar to some of California’s larger cities. Commercial buildings consume the lion’s share of Palo Alto’s energy. At the third level of energy use disaggregation, the information gets interesting: this is where we can start to identify exactly how and where building energy in Palo Alto is being spent.
This granular view allows a better perspective on what needs fixing, and where the best opportunities may lie for achieving deep carbon emissions reductions. This report is notable in that it provides a comprehensive overview of the energy use of one of California’s mid-sized cities. While it’s hard to define Palo Alto as average, we could be forgiven for calling its built environment typical. For this reason, we’re using this report to provide generalized insight into the energy use of ‘every town’ California.
Shifting our policy focus
By far the most eye-opening information exposed in this report is an innocent-looking set of bar-chart graphs, comparing the results of annual energy use through the three frameworks of zero net carbon, zero net energy, and zero net electricity. These simple bar graphs reveal a stark divergence of weighted priorities, when looking at energy use through these three specific lenses, prompting the question: What is the target we’re really aiming for with our buildings?
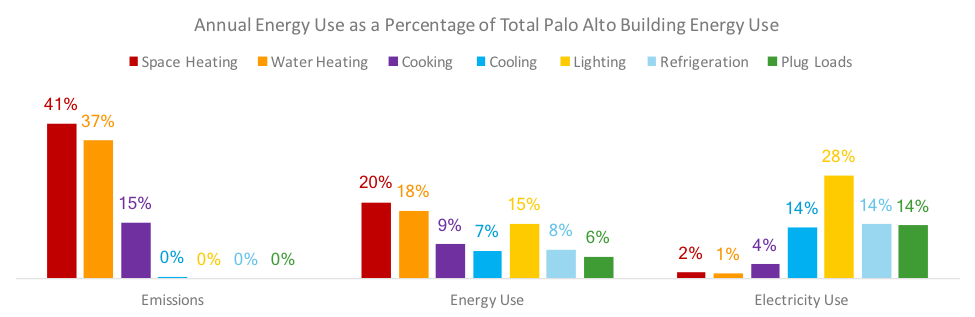
This is where the CEC’s recent leap-frog over zero net energy, in favor of a carbon reduction focus, starts to make more sense. This comparison graph reveals that if we look only through the zero net electricity lens, we’d be led toward heavily promoting daylighting and lighting efficiency measures, likely with minimal outcomes for carbon emissions reductions.
Similarly, the zero net energy lens offers a broader distribution of possible policy incentives. Some positive impact on carbon emissions reduction could be expected, but it’s clearly the zero net carbon lens that we simply cannot ignore. Even in the bucolic and supposedly mild climate enjoyed by Palo Alto, the highest building carbon emissions come from energy used for space heating.[5] Water heating follows closely behind, offering policymakers two unassailable choices: space heating and water heating. If policy is focused on only these two things, we’ll have a much higher chance of significantly reducing our carbon emissions from buildings.[6]
So, how do we achieve this most effectively?
Fortunately for us, the CEC’s FAQ already has much of this covered. Special mention is made of the new residential standards encouraging “demand responsive technologies including battery storage and heat pump water heaters.”[7] This is big. It signals a clear move towards the electrification of buildings — a big step for California, where gas has been the fuel of choice for many years.
With this combination of electrification, storage, and heat pump technology, hot water energy use will mostly be covered by renewable energy. Less clear in the CEC’s FAQ is a clear plan for how they’ll be reducing building space heating demand. Fortunately, space heating demand happens to be a particular specialty of the Passive House standard. For this reason, the modeled data from a cluster of buildings, all located in and around Palo Alto, provides a helpful comparison.
Palo Alto’s (mostly) Passive House cluster
The population of Palo Alto is known for its innovation and willingness to explore new technologies. This pioneering spirit extends to the built environment where the largest cluster of (mostly) Passive House projects in California is located. The projects we’re looking at here are not all certified Passive House buildings, but all of them used the Passive House Planning Package (PHPP) energy model to guide the design and construction.
Two of these projects are certified: the multi-generational home and the larger SFR-Luxury home. Their teams were kind enough to share the energy models for their projects with us and we’ve been able to generate a few simple comparisons of their assembly R-values and U-factors. The modeled performance metrics of these diverse buildings is instructional and provides insight on where the code may have room to move towards high performance targets such as those required by the Passive House standard.[8]
Diverse building types and sizes
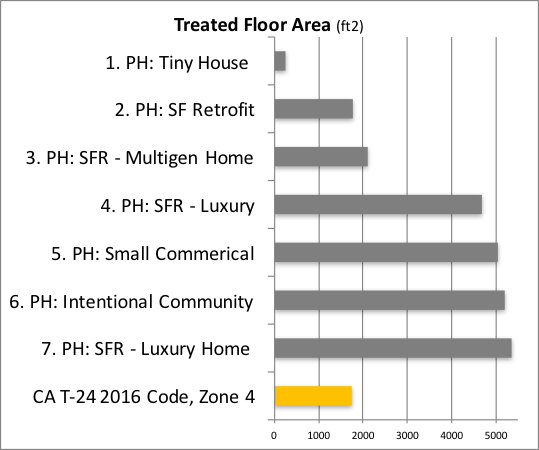
These projects represent a diverse range of sizes and use-types, ranging from a 252-square-foot tiny house (1 in the above chart) to two luxury homes of 4,687 square feet (4) and 5,341 square feet (7) respectively. They include a multi-generational single-family home (3), where an aging grandparent occupies an attached accessory dwelling unit (ADU), and an intentional community (6) housing a small commercial kitchen, full basement of shared community space, and eight dormitory-style bedrooms. Project five (5) in this cluster is a small commercial office building. One of the smaller residential projects (2) is a retrofit of an old 1920s holiday cottage. With the exception of the larger office buildings, this mix of buildings offers reasonable representation of Palo Alto’s diverse building types.
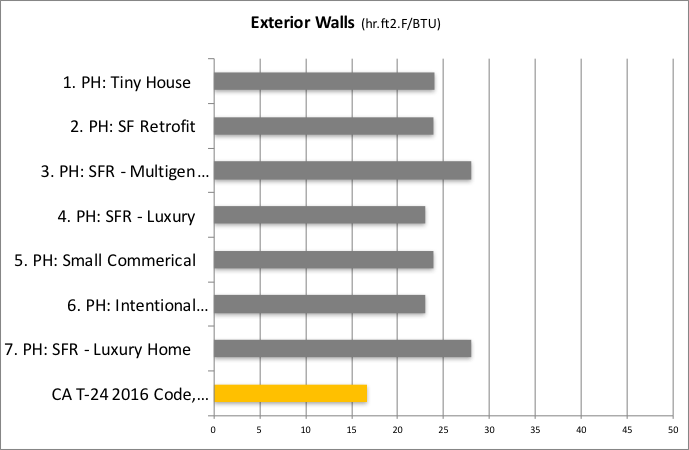
When comparing the R-values of the primary building envelope assemblies it is interesting to note the remarkable similarity in wall and roof insulation values for all seven projects. (Note: they were all designed and modeled by completely separate teams.) While the code-compliant wall insulation does not lag too far behind the PHPP-compliant projects, the fact that exterior walls are always the largest surface area of any building, makes this a key issue.
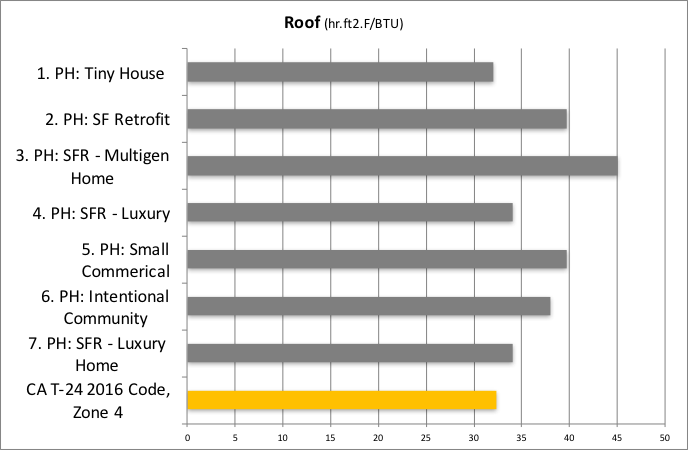
While walls still offer room for improved insulation, roof insulation levels are clearly well aligned. (Nothing to see here!)
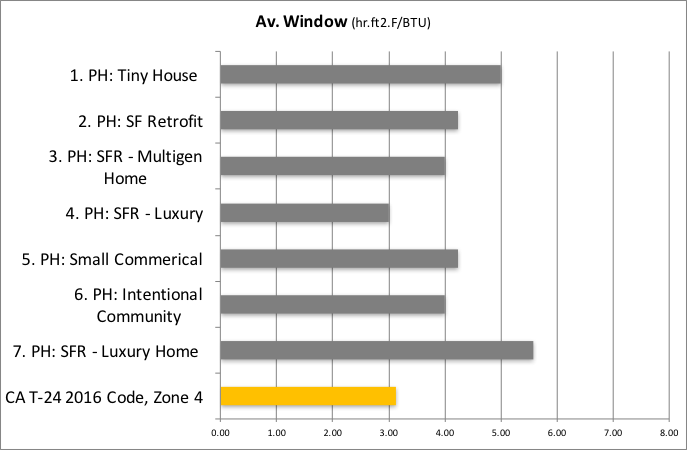
A larger divergence starts to emerge in the average window R-value comparison. The design team for Project 4 was the only one that opted for double-glazed windows. All other projects selected triple-glazed windows, indicating that, while it is possible to meet PHPP targets with double-glazing, triple-glazing may offer other advantages in this borderline climate. The Title 24 compliant windows in this comparison are represented as the “worst allowable” compliance value. We could reasonably assume that a code-compliant project with these windows should meet PHPP performance targets.
Caveat emptor: This particular comparison is somewhat complicated. Without going too far into the weeds here, it’s enough to say that a significant difference exists in how window performance is calculated via the PHPP compared to most other energy models. NFRC and the ISO 10077 testing protocols used by the PHPP have been shown to further muddy this comparison, so it may be safest to not draw any solid conclusions from this particularly simplistic comparison. (Windows are complicated and this graph isn’t.)
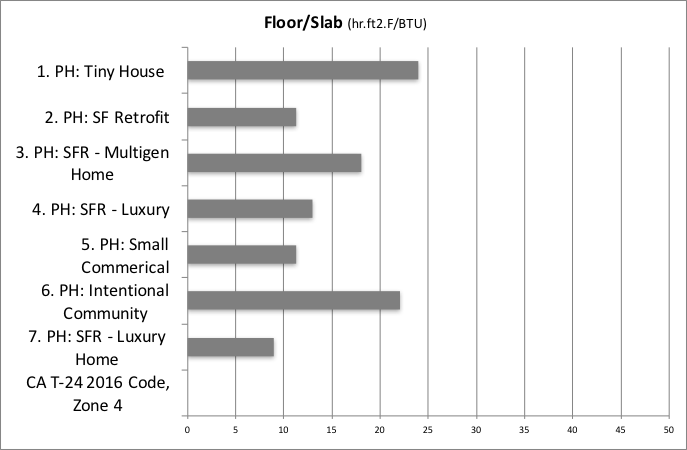
It’s at the floor/slab comparison where the largest differences appear. All but one of the PHPP-modeled projects employed a slab-on-grade floor assembly. The exception was (1), the tiny house, which required almost double the floor insulation of its peers. This is due to both its diminutive size and more vulnerable exposure to ambient temperature.[9]
Notably, the hypothetical Title-24 project shows no sub-slab insulation is required to meet code.[10]
Shifting code compliance
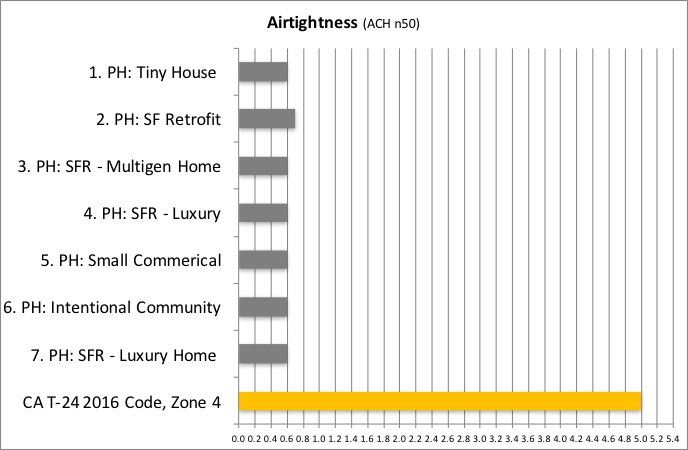
A final, glaring omission in the code compliance option shows up in a comparison of the airtightness testing for all these projects. They all met the required threshold for Passive House certification, including the retrofit, which is allowed slightly more leakage than its new-build counterparts (up to 1ACH/n50.) This indicates requiring airtightness is not an impossible task. Passive House projects delivered by experienced teams now routinely achieve airtightness testing results between 0.2 and 0.3ACH so we know that meeting airtightness targets is not difficult. Code enforcement agencies across the country [11] are increasingly recognizing tightened envelopes as an easy, cost-effective measure to drastically improve the performance of our buildings.
Measured performance
Unfortunately, we don’t yet have the measured performance metrics for this set of projects to enable a full comparison of their predicted and measured performance. We hope to extend this study in future to include that information.
Targeting loads
We do have a robust set of performance data for another Passive House project located just across the Bay in Alamo, California (and pictured at the top of this column). Despite being outside Palo Alto, this ~3,000-square-foot project shares many of the same features and assemblies as the multi-generational single-family home project (3) in the Palo Alto cluster.
It has a treated floor area of 2,342 square feet, wall assembly of R-28, roof assembly of R-46, windows of R-3.3, floor/slab insulation of R-14 and a slightly better airtightness reading of 0.3 ach50. This is an all-electric home, utilizing heat pump-technology for both hot water and space conditioning. It boasts a 7.5-kW photovoltaic array installed on the south-facing roof that powers both the house and an electric vehicle. While not certified, we’re reasonably confident this building meets the requirements of the Passive House standard.
Time of use matters
Monitoring of energy use of this building began in earnest by May 1, 2016. The daily energy use of the building since then has been remarkably stable, but it’s the bigger picture overview of energy use vs. generation that provides the most insight here (and reaffirms our conclusions drawn from the three framework comparison graphs generated in the Palo Alto report.)
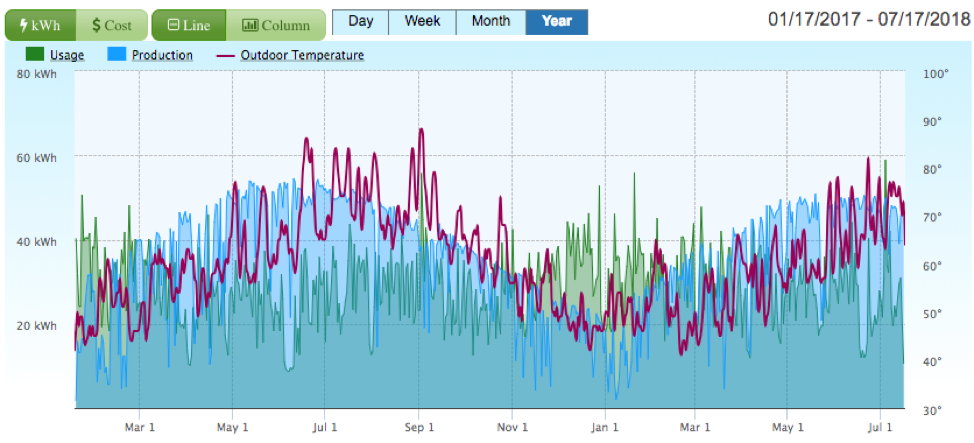
When we look at the graph plotting a full year of daily outdoor temperature (red line) against electric usage (green line) overlaid with energy production (blue line), we start to identify crucially important information. Even in our sunny California climate, in a house with incredibly low overall demand (including an electric vehicle), a 7.5 kW PV array is unable to meet all of its energy needs between the months of November and February. It shows that without battery storage, this house still requires a utility. This not only means that time of use matters, but that seasonal use matters and confirms that our most critical variable is, in fact, winter space heating demand – large portions of which cannot be covered by short-term battery storage.
Refocusing on emissions reductions
The information revealed by this monitored data, combined with the Palo Alto report, supports the new direction being taken by the CEC in its updates to our Title 24, Part 6 energy code. This direction was clearly outlined in the closing paragraph of their FAQ document:
“Looking beyond the 2019 standards, the most important energy characteristic for a building will be that it produces and consumes energy at times that are appropriate and responds to the needs of the grid, which reduces the building’s emissions.”[12]
Passive House California is in full support of this revised focus on building emissions reductions. However, the information we have shared here provides evidence that there is still plenty of room (and opportunity) to improve building envelope efficiency and to focus particularly on space-heating energy use reduction. We’re pleased to support the California Energy Commission’s efforts pointing our State in the right direction.
- PHCA is grateful to the owners and project teams who contributed their PHPP files to support this study.
- To find out more about the work of Passive House California, visit our website.
- To learn more about the Passive House standard, join us at the 2018 North American Passive House Network Conference (#NAPHN18) in Pittsburgh on October 17-21st.
Bronwyn Barry is a registered architect and a certified Passive House designer. She is board president of Passive House California.
Footnotes:
[1] http://aceee.org/blog/2018/09/california-must-go-big-energy
[2] https://www.cityofpaloalto.org/civicax/filebank/documents/63492
[3] http://www.energy.ca.gov/title24/2019standards/documents/2018_Title_24_2019_Building_Standards_FAQ.pdf
[4] http://www.energy.ca.gov/title24/2019standards/documents/2018_Title_24_2019_Building_Standards_FAQ.pdf
[5] Space Heating demand is also the highest energy user in commercial buildings, challenging the commonly held notion that commercial buildings in this region are ‘cooling load dominated.’
[6] Early projections indicate this same approach applies equally to our warmer, southern Californian climates where summer peak load reduction offers the same opportunities for full electrification. (More on this in future articles.)
[7] http://www.energy.ca.gov/title24/2019standards/documents/2018_Title_24_2019_Building_Standards_FAQ.pdf
[8] To clarify, we refer here to the targets of the international standard set by the Passive House Institute as these are universal for all seven projects and were the targets aimed for by these project teams.
[9] It’s not clear why project (6) required so much more insulation than the other PHPP-modeled projects. (We’d hazard a guess that this anomaly may be due to other factors, and was not necessary to meet a performance target, given that this project has a basement slab.)
[10] Not included in this graph is the perimeter slab insulation required for all these projects, including the code compliant building.
[11] https://cdn.ymaws.com/www.nibs.org/resource/resmgr/BEST/BEST2_022_WB6-5.pdf
[12] http://www.energy.ca.gov/title24/2019standards/documents/2018_Title_24_2019_Building_Standards_FAQ.pdf
Weekly Newsletter
Get building science and energy efficiency advice, plus special offers, in your inbox.


4 Comments
Thank you for this very in depth post on building in CA, the chart on airtightness, PH vs code is quite dramatic.
It's good to see a shift away from ZNE towards metrics that better measure what matters.
But more needs to be done on wider scale cost effectiveness. Ie, if building design can save a ton of carbon for $X and some other approach can save the same ton for $.5X, then focus on the latter. Residential PV solar is usually the wrong direction.
There is a lot of emphasis on carbon, but things like nitrogen dioxide are also quite important.
Yep! Getting rid of the gas furnace & water heater in favor of heat pumps & induction cooking takes a big chunk out of a home's carbon footprint at fairly low cost before even touching it's energy performance.
https://s3.amazonaws.com/greenbuildingadvisor.s3.tauntoncloud.com/app/uploads/2018/09/19150735/Figure3.png
Getting CA better integrated into the WECC grid markets could solve most of the issues relative to wintertime shortfalls of on-site or regional PV with a stroke of gubernatorial pen. There is resistance to taking those measures though, largely related to giving up some amount of control over energy & carbon policy to states & grid operators that don't necessarily share CA's zero carb dreams.
CA is unique relative to the rest of the US in that the both wind & solar output are minimized during the winter season, whereas in most other regions they are largely complementary, with wind output rising in winter. So in the "electrification of everything" scenario CA either has to over-build and curtail renewables, or do more with the available grid infrastructure (and even build some) outside their borders. At the still falling price of PV it may hit the point where overbuild & curtail is the cheaper option, but there are lots of moving parts to the model.
Of course there are also people taking bio-gas, hydrogen, or NH3 seasonal storage pipe dreams, but the napkin-math on most of it looks pretty bad even when the input energy is free excess renewables. The electricity->NH3->electricity efficiency even in most-efficient turbines is abyssmally low- less than 15%, which makes overbuilding PV pencil out favorable even at current cost of PV. Using nearly-free excess renewables for making NH3 for use as fertilizer (rather than fuel) might be both economic and lower carb, and could be important given the size of California's agricultural sector.
The cited statement in the closing paragraphs of this piece:
“Looking beyond the 2019 standards, the most important energy characteristic for a building will be that it produces and consumes energy at times that are appropriate and responds to the needs of the grid, which reduces the building’s emissions.”
That implies that SMARTER loads that can time-shift (smart car chargers, smart water heaters) and demand response (smart thermostats/ car chargers/ water heaters) with some amount of grid-operator control are likely to produce bigger carbon reductions than merely lowering the loads, once those functions are no longer using fuels burned on site.
A few minor points:
The 'standard' wall insulation in T24 2016 is a U-0.051, which is based on an R-19 wall (2x6 16"o.c.) with continuous R-5 insulation. This which is marginally higher than you're presenting, but still less than the PH project level, so I think your point still stands.
Airtightness: Title 24 has no performance requirement for airtightness. There is an assumption of 5 ACH50 for the purposes of modeling (since you have to assume something), but the real scandal is that noone knows what the airtightness of the homes are, and there are disincentives to find out.
Log in or create an account to post a comment.
Sign up Log in