More Energy Solutions


I’ve designed and built an inexpensive energy-consumption monitor using a Raspberry Pi. It enables anyone to monitor as many meters, panels, and breakers as they want. What follows is the story of how I came to build it and some of the things I’ve learned about my home’s energy usage in the process.*
Proud owners of an inefficient home
Back in 2017, I was living in a relatively small home here in Kansas City, Missouri, with my wife, Cecilia, and our newborn son, Bruce. Bruce’s arrival had prompted us to begin searching for a larger home. We wanted to find a four-bedroom home that would allow our family to grow without needing to move ever again, or at least not until everyone was off to college. Feeling guilty about the prospect of owning a large home, we were interested in finding one that we could ultimately make carbon neutral. That meant it needed to be all-electric and have a large south-facing roof upon which we could install a solar array.
After months of searching, we found a 3500-sq.-ft. Colonial-style house built in the late 1980s. With a simple roof that faced south-southwest, it fit the solar criteria. As an all-electric home, it had two heat pumps, one for each floor, with electric-resistance heat as backup. I inquired about the home’s electricity consumption and subsequent utility bills in the winter and learned that its worst month, February, was over $600. That figure scared us a bit, and we thought it might be better to buy land and build an efficient home from the ground up, rather than retrofit an existing house. But, if we did that, this old house would still be sitting there, owned by someone else, burning through untold volumes of coal every year. And lest I make us sound too altruistic, it also had an amazing backyard that was too good to pass up.
So, we became the new owners of an inefficient 30-year-old house. Where to begin? We addressed the low-hanging fruit first. All the incandescent lights were replaced with LEDs. The exterior doors whose jambs had started to sag were re-hung and weatherstripped. Fireplaces were caulked and plastic-wrapped where cold winter air could be felt coming through. The refrigerator, which was straight out of the 1987 Sears catalog, rattled and clanked, so it was replaced. Those were the items that were inexpensive enough to tackle without measuring if we were getting our money’s worth by replacing them.
The more expensive investments included the original windows with wooden frames and double-pane glass. Many of them had a fog on the inside, indicating that their inert gas had escaped long ago and on a cold day we could feel a breeze coming through the side jamb. Without a doubt, the windows were one of the leading causes of that $600 winter electric bill.
The heat pumps seemed to be in good condition but when temperatures dipped below freezing, the flickering of the lights made it easy to tell that the electric resistance heat had kicked in. I wondered how much power it was pulling to make the lights flicker. If those resistance heaters activate when it’s below freezing, would we save money by putting a space heater in our bedroom and letting the rest of the house drop in temperature through the night? Why heat 3500 sq. ft. when we’re sleeping in about 200 of that? And if we replaced the windows, how could we compare our energy consumption for two days with similar weather before and after replacing them? Would it be possible to isolate the climate control from the usage information on our electric bills? Probably not. I wasn’t comfortable making a huge investment in new windows and new climate controls without being able to measure exactly how much each change was impacting usage.
In search of full data sets
I started looking for a home-power monitor that could help me track our usage, so I could start optimizing these big-ticket energy-consumers. I found two products that stood out. One was designed for commercial-scale use; it tracks only the mains and attempts to identify appliance usage using machine learning. As a software engineer, I have worked with machine learning. I was immediately skeptical that it would be able to identify anything but the most common appliances. At $350, I wasn’t willing to gamble that it would give me the level of detail I wanted. The other monitor was an open-source device that could track up to 14 breakers. By the time you added 14 current transformers, it cost almost $300. Our house has 54 breakers—it would cost over $1000 to track everything. Even if I were willing to make that investment, the user interface was unsophisticated, and it didn’t provide simple ways of viewing different subsets of data. It did integrate with several other open-source projects, but their user interfaces also seemed lacking.
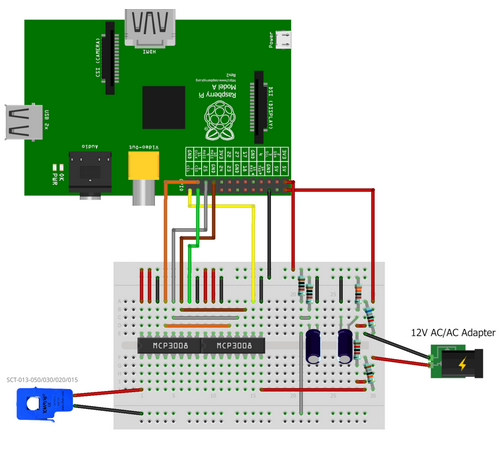
An avid DIYer, I thought to myself: How hard could it be to make a home monitor? I knew the current transformers and AC transformers that the other monitors use. P=IV, right? So, I just needed to sample the voltage and the current back-to-back as fast as I could, and then add it all up in software. I set to work soldering together my first breadboard prototype in January of 2020.
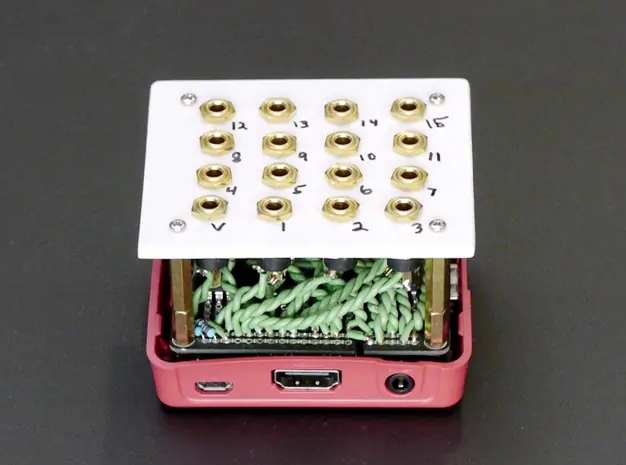
After getting it assembled, I found myself holding a spider web of copper and headphone jacks that didn’t look all that capable. But after coding together a simple-command line app to get a reading from it, lo and behold, it worked! For something that looked like a prop from an 80s B-movie, I could calibrate it to an incredible accuracy by comparing it to a Kill-A-Watt monitor. Encouraged by this success, I wrote an entire software platform that could take readings from multiple Raspberry Pis, or “hubs,” as I started to call them; and then aggregate them into complete energy-use summaries. To test the software, I soldered together two more breadboard prototypes and was able to track 45 breakers.
Identifying problems—big and small
Armed with this new tool and its vast array of data, I was ready to answer the questions I’d been asking about how to optimize my home. First question: How much does it cost to heat the entire upstairs at night with a heat pump versus only heating our bedroom with a space heater when it’s above freezing? I compared two days with the same average and low temperatures. Using the heat pump to heat the entire upstairs, four rooms, when it was above freezing took 15kWh. Heating only our master bedroom with two space heaters at the same outside temperature took 17kWh. Lesson learned: When it’s above freezing, go ahead and heat the entire upstairs and enjoy the comfort.
Second question: How does it look when it’s below freezing? Answer: When the central-furnace electric-backup heat engages, it takes over 16,000 watts! It’s no wonder the lights flicker when it turns on. At 10 p.m., the central furnace had already used 50kWh of electricity. Test aborted; no more data needed. With space heaters in our bedroom the next day, we were able to heat our bedroom all day for 35kWh. The downstairs heat pump does a little extra work to compensate for most of the upstairs not being heated, but the savings of not using the resistance heat upstairs more than outweighs the additional cost of the downstairs running a little longer while we’re sleeping. It’s clear that we need to avoid engaging that centralized backup resistance heat at all costs. These heat pumps are nearing end of life, and we’ll be shopping for a geothermal heat-pump system soon.
I was able to answer many simple questions with my whole-house monitor. For example, the house came with a glass-door mini-fridge. I wasn’t wild about the glass door and wondered how it compared to our new full-size fridge with a solid door. The full-size fridge is on its own breaker, and the mini-fridge shares a breaker with a few kitchen outlets that aren’t used most days. On a day when the mini-fridge and the full-size fridge are the only appliances in use, the mini-fridge consistently uses about 20% more electricity despite being about a quarter of the volume and not having a freezer. Turning it off and keeping everything in the big fridge saves 36kWh or about $4 per month.
What about the ceiling fan in the dining area? This is a tall room, and we use the ceiling fan to bring some of the hot air down. It’s a bit subjective, but it does make the room feel warmer, so we like to run it (80W on high, 40W on medium, and 20W on low). Medium and high create too much of a breeze anyway, so we can leave it on low for half a kWh per day to make it feel a little nicer in there.
In the process of monitoring, we found that our septic-aerator control module was broken, resulting in it running constantly at 300 watt—an extra 200 kWh per month. I had been paying a company to come inspect the septic system twice per year. That “inspection” amounted to opening the lid and making sure it wasn’t backed up. They didn’t notice the mechanical switch had cracked and failed. They wanted $400 to replace it with another mechanical switch that would undoubtedly fail too. I opted to fix it myself with a $5 solid-state relay attached to my power monitor. It turns it on for 15 minutes at the top of the hour like clockwork. That’s 150kWh or about $18 saved per month on the septic system alone.
Optimizing usage
In April of 2019, we had an 8kW solar array installed and turned on. Having solar panels results in a variety of new ways to optimize energy usage. By tracking production and consumption, we can calculate “from grid” and “to grid” readings per second and track peak values across any time frame. This yields the two values needed to size a battery-backup system to go completely off-grid: the capacity needed in kWh and the power rating in kW.
Fortunately, our electricity provider offers net-metering, so until we lower our consumption to the point where we’re meeting our needs with solar, we’re better off feeding the power back into the grid during the day. As more and more people turn to residential solar, there won’t be enough consumers to accept the over-production during the day. If large-scale storage is not solved by then, it will be important for individuals to calculate their own needs for storage.
In the spirit of sharing
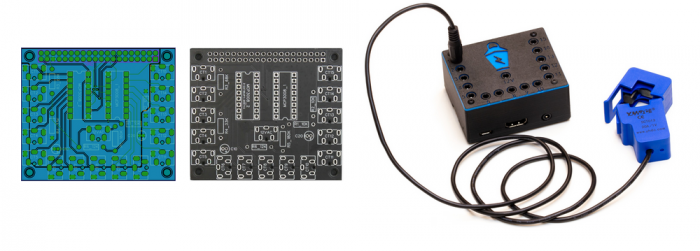
I was so happy with the quality of data that I was getting and the decisions it was allowing me to make, I decided to work on making it possible for others to build their own. That meant two things: releasing the source code and creating a Printed circuit board (PCB) design for the hardware. I could hardly expect anyone to solder together a rat’s nest like my prototypes. I put the code and PCB design on github, available for anyone to download and use. I also put a feature in the Android app that allows anyone to generate a bill of materials that will give them a complete list of every component they need to purchase to be able to assemble one.
A few dozen people have used the open-source materials to create and run their own power monitors, but for most people, ordering a board from a PCB manufacturer and assembling a hub is too much work. I often get requests to sell completed PCBs and completed power monitors. I had never expected to make a business out of this, but I’ve decided to test the waters and see if demand for a product like this is there. I’m offering kits and completed power monitors via Kickstarter. I hope people find it as useful as I have.
After using our power monitor for a year and a half, our most expensive electricity bill was $320, down from the previous owner’s $600. Our best bill was $56. As we complete projects moving forward—namely replacing the windows, upgrading the heat pumps, and improving the attic insulation—we’ll be able to analyze exactly how much each improvement is helping. With that knowledge, we can make a target for lowering our consumption and increasing our production to achieve our goal of living in a carbon-neutral home.
_________________________________________________________________________
Mark Milligan is a software engineer, DIY hobbyist, and founder of Lantern Software, Inc.
* Full disclosure, I’m in the middle of a Kickstarter campaign to start selling these power monitor devices. The most expensive component is the current transformer, which is the part that clips on the wire and measures the current through each breaker. When ordering more than 1500 current transformers, the price drops dramatically. The Kickstarter campaign is a way for me to order them in bulk so everyone can benefit from the reduced price. My only goal is to get this technology into as many hands as possible so people can start taking control of their energy consumption.
Weekly Newsletter
Get building science and energy efficiency advice, plus special offers, in your inbox.


41 Comments
Nice work!
I see a lot of requests for this in the Q&A all the time. There's def. a demand, even if it's a niche product. Thanks for putting the effort into it!
Really cool Mark! I've never done a Kickstarter before, how do I manage to get two of these (if that's allowed)? Do I make two separate pledges?
Tony
It's a little confusing the way I had to set it up. After you pick the reward and hit "pledge", it will take you to another page where you can add on additional rewards. The "Add-Ons" are the same as the rewards, so you can select as many additional as needed. Thanks for your support!
I absolutely loved reading this article and hearing about your product. I'm sure I'd enjoy the experience of building my own and have a number of projects I'd use it for within this year. I checked out your Kickstarter as well and will pledge to help reach the goal because its such an awesome idea.
Unfortunately it will only let me select the US as a shipping destination and I am in Canada. Though it says "Ships Anywhere" in the pledge description.
Right now only the PCB kits are shipping worldwide, but not the complete power monitors with current transformers. Let me see how much shipping to Canada would be and I'll get back to you.
Edit: I just added Canada as a destination for the completed power monitors with CTs. Shipping is $40.
“P=IV, right?” yes for direct current and sometime for alternating current. For AC loads the peak current flow and the peak voltage will often happen at different times in the cycle.
I am sure you have not gotten to this point with this product without someone else pointing out you could be off by up to 50% or more.
https://www.pema.ie/TECHTALK%20LIBRARY/APT/True%20vs.%20Apparent%20Power.pdf
Yes your reading for resistive loads like your heaters will have a power factor of 1 and read very accurately but for things like LED lights and motors your numbers could be so far off that they have no meaning.
Could you add power factor correction to this project?
It's calculating real power, not apparent power and accounts for the power factor by measuring the voltage and the current in rapid succession. Things like our heat pump have an apparent power of 50W when sitting idle, but when you calculate real power (which my monitor does), you find that the idle power is more like 12W.
I'll point out that P=IV always, even for AC flow through non-resistive loads. The fact that the current and voltage waveforms may not line up is precisely why you need to measure both to be able to calculate the real power.
Here's a more in-depth article explaining how it's done:
https://learn.openenergymonitor.org/electricity-monitoring/ac-power-theory/introduction
Thank you for doing this work and providing the information. I'm pledged for a complete unit and an additional PCB. If all works out I would be buying a couple a year at least for my projects. Good luck
I was pretty sure you could not have gotten this far with this project without doing power factor correction.
You may want to make it very clear that you are correcting for power factor consider using the words “true power” a few times.
It looks like you are monitoring 50 breakers so you need 4 units correct?
How would the 4 units be networked if the unit are in different panels and separated by some distance would that be a problem?
240 volt loads only need one current transformer and you can tell the software what loads are 120 and 240 volt correct?
Walta
For most of the double pole (240V) breakers in my home, I'm monitoring only one pole and doubling it in software. In the configuration of the power monitor, you can select to monitor only one, or both poles of the double pole breaker. As Trevor mentioned below, double pole breakers that power a range will also have a neutral wire so the 120V portion can be powered (clock, fan, etc), so it may be worth measuring both poles separately, but the usage of the clock is so small, it's probably not worth using one of your ports. Items such as a water heater don't have a neutral wire and monitoring the second pole separately is not needed.
Since I have a lot of double pole breakers, I'm able to monitor them all with three hubs. Two hubs are in the garage with three panels there. One hub is on a subpanel in the basement. All of the hubs are connected to wifi and send all of their data to a central server where the raw data is assembled into one energy summary. The "central server" can be the one provided by Lantern, or you can host your own server on a pi, or on your own computer. The diagrams here may help explain more:
https://lanternpowermonitor.com/architecture
Here's a link that demonstrates the configuration in the app:
https://lanternpowermonitor.com/configuration#panel
Nice work.
For clarity: Is the 'one CT clamp per double pole breaker' just because it assumes a purely 240v load? I.e. are we just ignoring the 120v (unbalanced) loads that modern appliances with NEMA 14 plugs might use?
That is the standard assumption. Note that a lot of 240V appliances have balanced loads. This includes most water heaters and mini-split heat pumps, and any appliance originally designed for markets outside North America (e.g. global brands of cooktop and range). For the exceptions you could use two clamps, but it might not be worth it. The only thing contributing to the unbalanced load portion is the control electronics, which is a pretty small proportion of the total load of the apppliance.
May want to look at some of the newest air-source heat pumps. Mitsubishi has a conventionally ducted unit that operates down to -13 F.
Very cool project. If I didn't already invest in a competing product I would be in. Just out of curiosity, had you heard of Brultech when you started? Their system is a lot more expensive, but would probably have saved you a lot of time.
So, just made my "pledge" and realized my only "real" question is how is the info reported? Bluetooth app, connected display monitor? Just askin.' Or, I can read deeper and see that magic connects everything to an APP on your phone.
Raspberry Pi's have built-in blue-tooth wi-fi (is my understanding). His diagram here shows what happens from there:
https://lanternpowermonitor.com/architecture
Hey, thanks for doing this. Happy to support the project. Will pledge shortly.
Is it possible to get to 20CTs/board. this nice round number means we only need two birds for 40 space panels, and 3 for 60 space.
You can imagine doubling the board to make a single piece of silicon for a 40 space board.
Looking around a bit to see what other monitors offer...
I like a lot of what is being offered here vs something like Sense, but echo a few of the requests for 'enhancements' that I see listed on your github page. Not sure what likelihood/possibility there is of these getting implemented?
1) Monitor total (mains) power in addition to the breakers.
2) Add 'sense like' appliance detection (programable... not as 'intelligent' or involved as Sense, but to ID substantial appliances sharing circuits)
and, of most value to me:
3) Voltage monitoring and quality analysis.
I will note that Sense does all 3 of these things, which may be a selling point for those comparing specs, but I share the lack of trust in relying solely on machine learning, a big plus for Lantern PM.
Re 3: Are any voltage measurements displayed in the app currently?
Many energy monitors plug into both (or multiple) phase legs for voltage monitoring. I am not sure if they are pairing each leg measurement with the appropriate current reading for a more accurate power calculation, but at the least it can indicate when there are issues with the neutral, etc. Seeing as the Lantern PM plugs into an outlet, the voltage measurement is presumably of only one leg-to-neutral.
If the Raspberry Pi platform makes this a difficult prospect (?), perhaps one hub can connect to one phase and a separate hub to another? I see this mentioned in your threads regarding 3-phase, but then can the app handle displaying and analyzing the appropriate voltage data to track power quality, etc.?
The app shows the voltage reading when calibrating, and a voltage reading is sent to the server every second along with the power readings from each of the 15 ports. That voltage reading isn't displayed heads up next to all the power readings right now, but I could find a place to put that in the UI, the data is already going to the phone.
The gpio ports on the pi's have two dedicated chip select pins. I'm using MCP3008 chips to do the analog to digital conversion, each of which has 8 channels. So with the hardware I'm using now, I've got 16 total ADC channels to play with. To get the most out of each pi, I chose to monitor one phase with one voltage transformer and use the rest of the channels for measuring breakers. There's nothing saying I couldn't design another board and use one more channel to read the other phase (or 2 more for 3-phase), but to get the most bang for your buck, I opted to infer the other phase(s). If you hook up a second hub and put its VT on an outlet on the second phase, then yes, I'd have data from both phases and with a little extra config, I could display them separately in the app.
Priority-wise, adding the real-time voltage reading heads up is super-easy. If you want to see a historical graph of every reading for the time frame that you're looking at and the ability to label the phase for each hub, that would take a little longer, but all of the data is being tracked and stored currently, it just needs to be packaged up nicely and sent to the phone.
I think the next highest priority will be tracking the mains separately. I imagine a lot of people will not end up tracking every single breaker in their panel, which becomes a problem if you also want to track from grid/to grid. The software change is probably only a few days, but I need to acquire an appropriate CT that's big enough to go around the mains and is properly insulated so I can test here in my home.
I think the sense-like functionality is a pretty low priority. Once you're tracking every breaker individually and can see that detail, I think you'll find that it's pretty easy to pick out the usage of a dishwasher from a garbage disposal or lights that are all on the same breaker. I might do it some day, but not until there was a lot of demand for that feature.
Sounds like a fantastic project! I am ready to add to your Kickstarter campaign, but I am unclear about the add-on options for the main PCB kit with the VT & 15 CTs. If I wanted additional CTs for additional breakers, I would need another PCB kit and CTs but not another VT, correct ? Is there an add-on option for just PCB & CTs ?
Each PCB needs its own voltage transformer. I have two in my garage and the VTs are plugged into a power strip. It's important that each PCB gets its own clean voltage signal to get an accurate reading.
“[Deleted]”
Thx for your reply. Did not realize but it seems that KS campaign ended yesterday. Please let me know if I can still be add to the project.
@mark - I'm strongly considering backing this, and as an engineer in a similar space it seems like a fair price for the HW, and I greatly appreciate your privacy policy & open source approach - (for readers: means buyers can use the device even if the business were to later pivot or disappear, or if the user wants full local data control)
I don't see anything here or on github about CE certification, or the way the high-voltage safety is handled. I don't typically deal (in my professional life) with anything over 48 volts, so this isn't a space I know much about - obviously when working as intended the transformers step down the signal to the MCP3008's input abs max (Vdd + 0.6 volts) - but isn't there some sort of protection required somewhere here to isolate the PI / user in the case of component failure, etc?
The YHDC SCT013 CTs are CE certified and have a burden resistor built into them that is appropriate for the amperage rating of the CT. This burden resistor prevents a large voltage from being induced in the secondary winding.
Many other power monitors have the burden resistor built into the board and use a CT without a burden resistor built in. The problem there is if you connect that CT to a breaker with the CT not connected to the board, an extremely large voltage can build on that disconnected end of the CT which provides a safety concern. I chose to use CTs with the burden resistor built in so if they are mistakenly connected to the breaker before they are connected to the board, it's still reasonably safe.
The other problem with building the burden resistor into the board is that it must match the size of the current transformer chosen. So many other boards scale for the maximum, a 100A CT. The problem then is the accuracy is reduced at low power. I feel I've chosen a design that provides both safety and accuracy.
Thank you for your reply.
I've backed you for three full kits (looks like the KS just made it over the finish, too, congrats!)
One of the things that I often recommend an IotaWatt for is load studies--monitoring the main feeder currents to see what the peaks are. This is useful for people planning for electrification--replacing gas appliances or adding EVs, and wanting to check whether they have the capacity available or need some load management or a service capacity upgrade. So I agree that adding the capability of monitoring the mains is important. Also important will be software to allow the user to see current for that purpose, not just power. With IotaWatt, there's no built-in capability to report the magnitude, size, and time/date of the largest peak--you have to download the data and use some other software, or page through the plots of different time periods. that would be a feature that could be a real differentiator to make your product more attractive than IotaWatt.
Overall, it does seem like you are offering better value per dollar than IotaWatt, especially for people who are willing to build up their own boards, and I hope the Kickstarter succeeds--it would be good to have some competition for IotaWatt. The numbers are close but time is running out!
The Lantern Power Monitor is already capable of showing this data. When you track every breaker in your panel(s) there's no need to track the mains separately because the summation of the individual breakers will match the mains. You can see peak power for any day, month, year, or lifetime heads up in the app today. Of course this only works if you track every single breaker, so the feature to track the mains separately is an enhancement for those who don't want to invest in enough current transformers to track everything separately.
Sorry, I might not have emphasized the key point clearly enough: RMS current, not power, is what is needed for evaluating capacity. It shouldn't be hard to report that, given that the raw data from the CT is current, and calculating RMS is as easy as calculating power, but as I understand it, that is not yet available in the software.
Oh I see, sorry I misunderstood. Yes, the hubs are calculating the apparent power by using the RMS current and RMS voltage, but right now only the real power is being sent to the server. I could send both but the storage needs would be doubled. I'll put a little more thought into this, thanks for bringing it to my attention!
Congratulations on the kickstarter success, and thanks for thinking about how to address this use case.
Alright I'm on board.
I missed this. Is there any way to still order one?
Mark just realized that you campaign has ended. Is it still possible to make a pledge? I am interested in the PCB Kit + VT and CTs .
If so how do I go about it? The mains for my panel is 200 amp. Are there 200 amp CTs?
From the discussion above, I understand that monitoring DC circuits is different than monitoring AC circuits. My setup will include solar PV, batteries, and a variety of DC circuits. Could I use this to monitor the DC circuits as well as the AC circuits in my house?
Unfortunately, no, the current sensors won't work with dc, and the software isn't set up to deal with that either. IotaWatt can't do dc either.
There are lots of instruments that can do dc power measurement and logging, and a lot of PV and battery systems have some of that capability built in. But I don't know of anything moderately priced that is pre-configured to monitor multiple channels. Here's a really nice system, but I expect it's expensive:
https://www.packetpower.com/dc
If you want to repeat the project of developing your own system, dealing with DC is simpler as far as doing the power calculation/measurement, and you can use really slow sampling rates. For example, this kit could give you up to 16 channels of data logging with the right Arduino:
https://learn.adafruit.com/adafruit-data-logger-shield
Combine that with current sensors at maybe $20 each.
Great tip. I'm a fan of adafruit.com. I'll check that out.
Not sure if this is the best place to ask this question, but here goes:
We are building a Granny Suite next to our house, with the power usage all running through the meter on the main house.
The local energy authority does not allow a separate meter, so how can we determine the portion of the bill that can be allocated to the Granny Suite?
Note that we are NOT electrically astute.
The DIY option described in this article is very powerful and extremely handy, but I wouldn't say it was applicable to somebody who is not electrically or technically astute.
A better bet for you might be a more user friendly option like the Emporia Vue monitor. It's notably less expensive than the iotaWatt and much more user friendly, while still offering circuit level monitoring. Definitely not as flexible or powerful, though.
In your case, just hook the Vue main clamps to your Granny Suite sub panel lugs and that'll give you exactly what you're wanting to know.
Wow! Thank you so much!
Log in or create an account to post a comment.
Sign up Log in