
More Guest Blogs


Air pollution contributes to as many as 9 million premature deaths worldwide each year—twice as many as war, other violence, HIV/AIDS, tuberculosis and malaria combined. Fine particulate matter air pollution is especially dangerous: Microscopic particles readily enter the lungs, bloodstream and brain, with health effects that include infant death, reduced life expectancy for adults, cancer, lung disease and heart disease
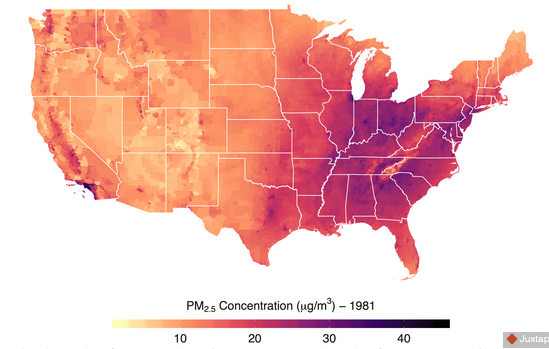
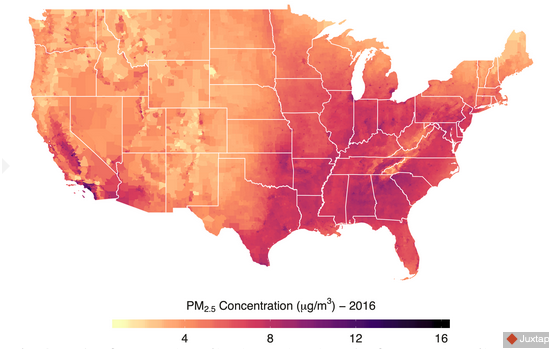
Fine particle matter pollution concentrations in the United States have declined by roughly 70% since 1981. However, in a newly published study, we show that the areas that were most polluted in 1981 are still the most polluted today, and the least polluted areas in 1981 are still the least polluted today.
Areas that were whiter and richer in 1981 have become relatively less polluted over time. Areas that became whiter and richer between 1981 and 2016 have become relatively less polluted over time. In contrast, the neighborhoods and population groups that were most exposed to fine particle pollution 40 years ago—disproportionately low-income and minority communities—are still exposed to higher pollution levels.
As scholars who focus on environmental economics and public policy, we believe that the persistence of air pollution disparities matters. We care about who is advantaged and disadvantaged. In addition, our results have implications for environmental public policy. To the extent that policy aims to reduce pollution disparities, the job is far from finished.
Mapping pollution at a neighborhood scale
Researchers have known for decades that air pollution varies across locations due to economic activity, climate and other factors. It is also well documented that lower-income households, people of color and other disadvantaged communities are disproportionately exposed to air pollution. Since research shows that air pollution is associated with early death, lower educational attainment and lower lifetime earnings, these differences promote economic, health and social inequality.
What has not been clear is how much air pollution disparities have changed over time. We wanted to understand particulate matter air pollution disparities in a more systematic way, for the entire U.S. over many years.
Until recently, the information needed to answer this question simply wasn’t available. The U.S. Environmental Protection Agency monitors levels of fine particle pollution, known as PM2.5, nationwide. But its monitors offer relatively sparse coverage and are concentrated in disproportionately urban locations.
In our study, we leverage newly available data that captures PM2.5 concentrations at more than 8.6 million distinct U.S. locations from 1981 through 2016. These data were constructed from satellite observations and pollution transport modeling, along with pollution monitor records. They provide a detailed year-by-year picture of fine particulate matter concentrations for each of the roughly 65,000 census tract “neighborhoods” in the United States.
Persistent disparities
Our analysis shows that there has been some progress over the past 35 years in reducing gaps between the most polluted and least polluted locations. In 1981 PM2.5 concentrations in the most polluted 10% of census tracts averaged 34 micrograms per cubic meter. PM2.5 concentrations in the least polluted 10% of census tracts averaged 13 micrograms per cubic meter. The difference was 21 micrograms per cubic meter.
In 2016 PM2.5 concentrations in the most polluted 10% of census tracts averaged 10 micrograms per cubic meter. PM2.5 concentrations in the least polluted 10% of census tracts averaged 4 micrograms per cubic meter. The difference was 6 micrograms per cubic meter.
These reduced gaps likely imply that differences in pollution-induced health, wealth and productivity across locations are also declining. But while pollution gaps have declined for some disadvantaged communities, this hasn’t been universal.
Next we wanted to see whether specific locations had more or less pollution than other locations, and whether the most polluted locations were the same through time. To explore these questions, we ranked each neighborhood from most polluted to least polluted for every year that we had data.
We then evaluated how these rankings changed between 1981 and 2016, and found that they remained remarkably persistent.
The most polluted areas in 1981 remain the most polluted areas today, and the least polluted areas in 1981 remain the least polluted areas today. Communities that were disadvantaged in 1981 remain exposed to higher levels of pollution today. If anything, relative disparities have worsened for poorer and Hispanic communities.
A disproportionate share of the most polluted areas over the past 40 years are in Southern California, while the least polluted areas are more dispersed across the U.S. As an example, a child born in Los Angeles County in 2016 was exposed to 42% more fine particle pollution than the average child born in the United States, and 26% more pollution than a child born in New York City.
A few areas did see improvements or declines in their relative standing. Ohio, West Virginia, eastern Kentucky and the Northeast Corridor became relatively less polluted from 1981 through 2016. California’s Central and Imperial valleys, southwestern Arizona, southern Texas and portions of Arkansas and Oklahoma became relatively more polluted.
Fairness, equity and public policy
Our findings underline the scope, scale and persistence of air pollution disparities in the United States. But if particulate matter air quality has improved over time—which should translate into improvements in health, wealth and productivity for most Americans—why should we be concerned about relative disparities between some locations and others?
In our view, persistent disparities between the most and least polluted communities matter because fairness, equity and justice are relative concepts. We define them based on who is advantaged and who is disadvantaged at any given time. Pollution disparities translate into health, economic and social disparities.
For decades, federal and state environmental guidelines have aimed to provide all Americans with the same degree of protection from environmental hazards. The EPA’s definition of environmental justice states that “no group of people should bear a disproportionate share of the negative environmental consequences.” On this front, our research suggests that the United States is falling short.
Jonathan Colmer is Assistant Professor of Economics at the University of Virginia. Jay Shimshack is Associate Professor of Public Policy and Economics at the University of Virginia. Ian Hardman, research associate at Stanford University’s Program on Energy and Sustainable Development, and John Voorheis, lead economist at the U.S. Census Bureau’s Center for Economist Studies, co-authored the study described in this article. Any opinions and conclusions expressed here are those of the authors and do not necessarily reflect the views of the U.S. Census Bureau.![]()
This article is republished from The Conversation under a Creative Commons license.
Weekly Newsletter
Get building science and energy efficiency advice, plus special offers, in your inbox.


3 Comments
Perhaps the professors should dig a little deeper taking into account the impact of geography (ex, LA basin) and differentiate between natural and man-made sources of PM2.5
There's info out on global air quality where an increase in air quality (e.g., decrease in particulate) over the past few decades is associated with a rise in Atlantic hurricanes. I think it was BBC or PBS today (6 Nov 2020). Climate/human phenomena are incredibly complex. Dyson (James Dyson) has funded air quality studies using mobile/backpack sensors with GPS, the data are expected to show the impact of shutdowns. When it comes to equity, we know Flint is recent history. And, don't forget Bernie moving the radioactive waste of VT to the borderlands in TX, to the strenuous objections of Paul Wellstone. Not sure we have enough politicians that care or care to know.
"In contrast, the neighborhoods and population groups that were most exposed to fine particle pollution 40 years ago—disproportionately low-income and minority communities—are still exposed to higher pollution levels." Is there any data that shows why this is so (like what type of particulates (vehicle exhaust, dust kicked up by more vehicles in urban settings, etc.), less green space available (possibly to filter out particulate matter), etc.)? Just saying "the measurements say so" without knowing what/why means we are not anywhere near proposing solutions.
Log in or create an account to post a comment.
Sign up Log in