
Image Credit: Image #1: Energy Vanguard
More Building Science


At the North American Passive House Conference in Philadelphia in September, I gave a presentation on the global warming impact of insulation, an issue I’ve discussed a few times since Alex Wilson wrote his paper on the topic back in 2010. In my presentation, I covered two different aspects of the issue: (i) the problem with Wilson’s payback calculations and (ii) using David White’s global warming impact calculator to make more informed decisions.
I’ll discuss these two aspects of the issue in two articles, giving you the payback part here and the calculator in two weeks.
Diminishing returns and payback
I don’t know why it took me so long to figure this part out, but I didn’t see it when I first wrote about Wilson’s payback calculations. Now it seems pretty clear. Let’s see if I can convince you.
To calculate how many years it takes to pay back the cost of something, you need to know what the savings are per year. In this case, we’re not talking about money. We’re talking global warming emissions, but the principle of payback is the same. In Wilson’s calculations, he used a calculation method for energy savings that made two of the insulation types look really bad. (Those two were extruded polystyrene and closed-cell spray polyurethane foam.)
That calculation method he used was to split the energy savings due to the highly insulated walls in their study into two parts. The initial energy savings went to the cellulose insulation in the 2×6 wall cavities, with a whole-wall R-value of R-14. Then they added more insulation of the various types they studied and calculated how much energy that “extra” insulation saved.
That might make sense if you have an existing home with already-insulated 2×6 walls. But if you’re building a new home, I argue it doesn’t make sense. More on that in a bit.
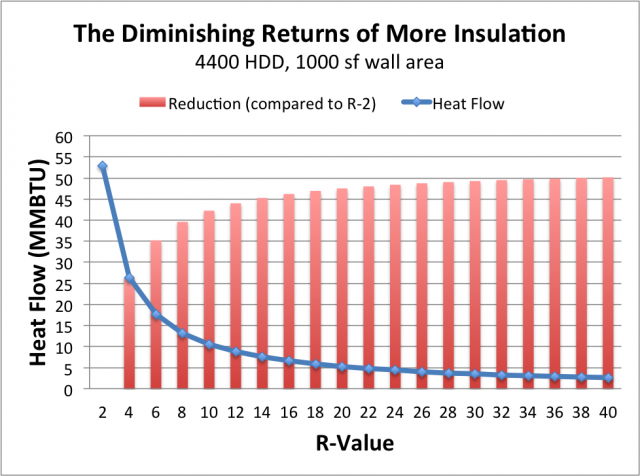
The reason that splitting the energy savings like that yields misleading results is due to diminishing returns. As you can see in the graph below, by the time a wall is insulated to R-14, it’s already got most of the energy savings it’s ever going to get. You can keep adding more, but you get less and less energy savings for each additional inch of insulation. The returns diminish.
Calculating in a different order
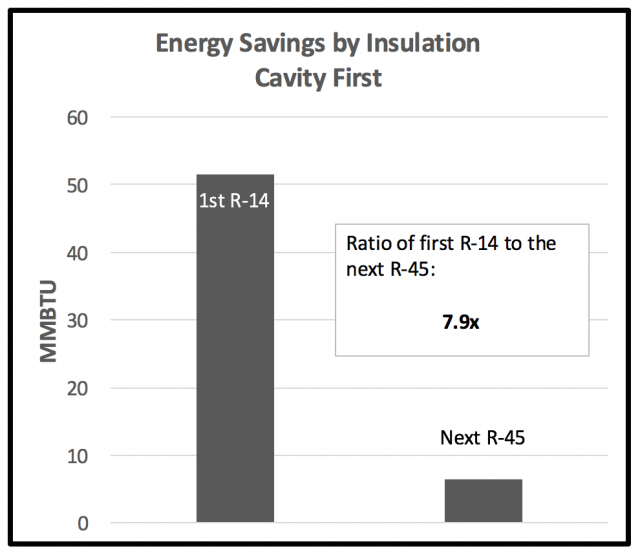
Let’s take a look at some actual numbers. I used a total R-value of 59, split into two parts: R-14 (representing the insulation in the cavities) and R-45 (the additional insulation on the exterior). When I calculate the amount of energy savings attributable to the R-14 first, I get the graph below. The cavity insulation saves about 51 MMBTU per year. The exterior insulation saves about 6.5 MMBTU per year. The cavity insulation saves 7.9 times as much energy as the exterior insulation.
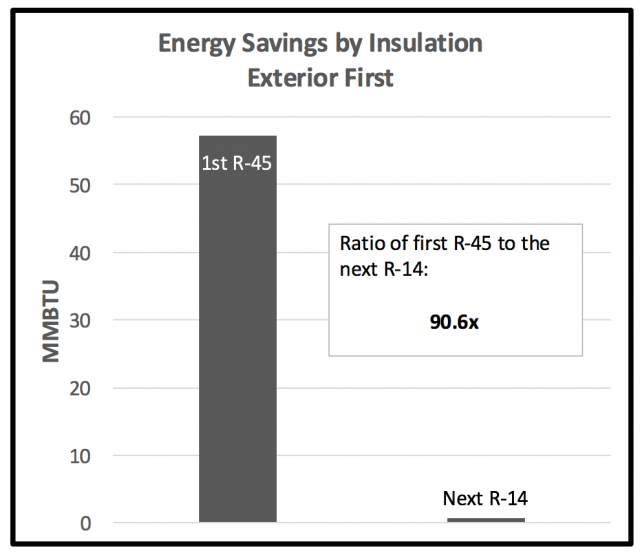
If I do that same calculation in the reverse order, the results are very different, as shown below. The R-45 exterior insulation will save 57 MMBTU per year, and the R-14 cavity insulation saves only 0.6 MMBTU per year. So the exterior insulation saves about 91 times as much energy as the cavity insulation here.
Looking at it this way, you might say, “Hey, we’ve already got 98.9% of the savings with the R-45. Why don’t we just skip the cavity insulation? We’ll get almost the same performance.”
The effect on payback
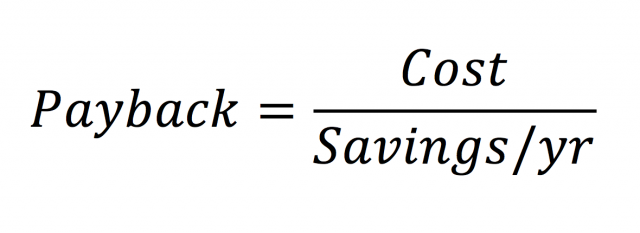
How do these results affect Wilson’s payback calculations? Let’s work through the calculation. The equation for simple payback is shown at right.
Regardless of which order you use to calculate the energy savings, the cost in global warming impact should remain the same. The global warming emissions from the making of the insulation (all types) and the emissions from the blowing agents (foam) don’t change.
So to calculate the effect of calculation order on payback, we need to adjust the denominator in that little equation.
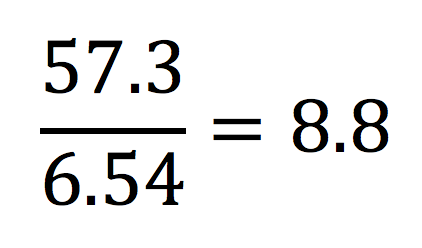
What we want to know is the ratio of the savings when you calculate the R-45 exterior insulation first versus when you calculate it second. And those numbers are 57.3 MMBTU/year for R-45 first versus 6.54 MMBTU/year when you calculate the R-45 savings second. That ratio is shown at right.
The conclusion here is that you get 8.8 times as much energy savings simply by calculating in the reversed order. Let’s apply that to Wilson’s results.
Below is the graph Wilson presented for doing the calculation with the R-45 savings second.
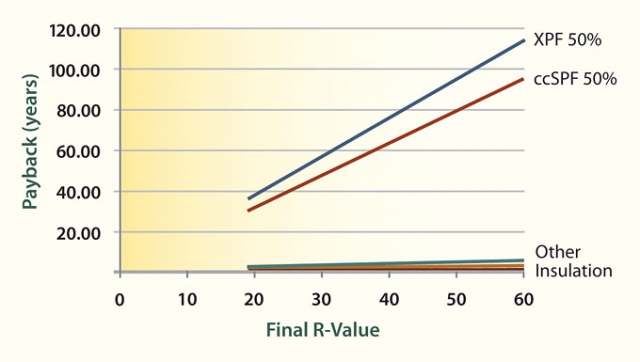
Calculating the R-45 savings first would lower all the lines on the graph by a factor of 8.8. Most of the insulation types are already really low so I didn’t adjust them. But if you lower the lines for extruded polystyrene (XPS) and closed-cell spray polyurethane foam (ccSPF), here’s what happens:
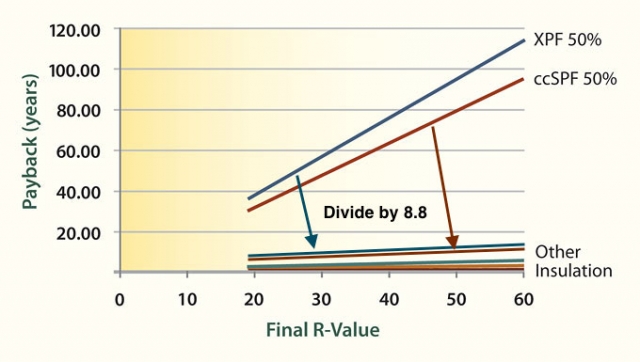
Just by reversing the order, the payback for all insulation types, even the two “bad” ones, drops to less than 20 years. You have to go well past R-60 to hit 20 years, but the insulation should last 50 years or more.
What R-value should you use?
One other thing I pointed out about this issue is the actual R-value used. Wilson’s graph goes all the way up to R-60. Do you ever need to use that much? We know about the diminishing returns of adding more insulation. When does it make sense to stop? Well, we now have some good guidance from the Passive House Institute US (PHIUS).
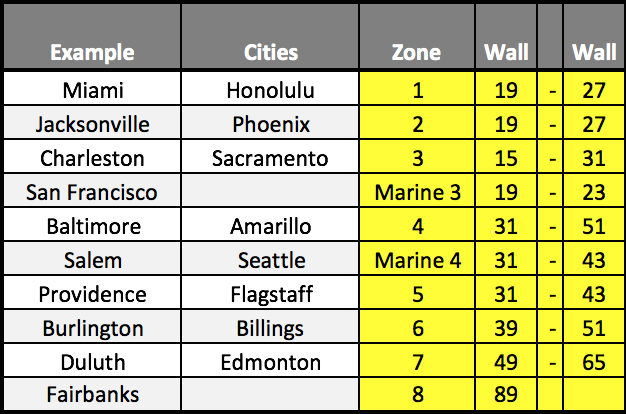
The table at right shows the R-values needed to meet the PHIUS climate-specific standard in different climate zones. Up to Climate Zone 3, R-30 or less is all you need. For Climate Zones 4, 5, and 6, you can stop at about R-50. It’s only in the sparsely populated Climate Zones 7 and 8 that you need lots and lots of insulation, especially in Zone 8.
When you look at graphs like Wilson’s, whether adjusted the way I’ve done or not, keep these numbers in mind.
In case you’re wondering, the numbers I calculated above include only the energy savings due to heating.
The baby and the bathwater
If you buy into my argument, you should agree that Wilson’s conclusion to avoid XPS and ccSPF wasn’t warranted. If you don’t buy into my argument, please let me know why. I’m not saying those two materials are neutral in all respects in comparison to other insulation materials. There are certainly other issues to consider. But when we look just at energy savings and global warming impact, XPS and ccSPF aren’t as bad as it first seemed.
Wilson’s study, however, is still important. As I pointed out in my last article on this topic, the real significance of what he did was to get us thinking about this issue and actually calculating global warming impact. David White of Right Environments in Brooklyn developed a spreadsheet calculator to do just this. And that’s the subject of the second part of my conference presentation, which I’ll discuss in my next article on this topic. Stay tuned.
Download the slides from my North American Passive House Conference presentation
Allison Bailes of Decatur, Georgia, is a speaker, writer, building science consultant, and the author of the Energy Vanguard Blog. You can follow him on Twitter at @EnergyVanguard.
Weekly Newsletter
Get building science and energy efficiency advice, plus special offers, in your inbox.


8 Comments
Response to Allison Bailes
Allison,
You wrote, "If you don't buy into my argument, please let me know why."
You have set up a straw man argument. You have demolished an argument that Alex Wilson never made.
Let's read what Alex Wilson actually wrote in his GBA article:
"If you add four inches of polyisocyanurate (R-25) to the 2x6 wall, for example, (R-39 total) the lifetime GWP payback for that added polyiso insulation would only be 2.7 years. Even if you go all the way to a final R-60 for the wall system (adding 7.5 inches of polyiso), the payback would be only slightly over four years. By comparison, if it’s XPS you’re adding to the 2x6 wall, the payback for that added insulation is much longer. Adding one inch of XPS has a 36-year payback. With two inches, the payback jumps to 46 years, and with four inches, 65 years. To go all the way to a final R-value of R-60 (adding about 9 inches of XPS) would have a payback of over 110 years. For SPF, the paybacks will be similar, though somewhat lower."
Alex's list of examples for XPS starts with one inch of XPS. In your blog, Allison, you have focused on the most unlikely example in Alex's list -- the R-59 or R-60 wall -- and given it undue attention. Alex didn't focus on that wall, Allison -- you did.
In spite of the fact that Alex discussed walls with one inch of XPS, or 2 inches of XPS, or 4 inches of XPS, you criticize Alex for the R-60 wall example, noting, "Wilson's graph goes all the way up to R-60. Do you ever need to use that much?" But Alex's blog didn't focus on R-60 walls. You chose to focus on R-60 walls for one reason -- because it aided your straw-man argument.
Alex looked at homes with 2x6 walls that have fluffy insulation between the studs. Is that a common cold-climate wall? Absolutely. It is by far the most common type of wall in colder U.S. states, and has been for decades. We all know the payback period for the fluffy insulation between the studs. It's quite quick.
Alex looked at the payback period for the additional rigid foam insulation that is sometimes added to the exterior side of this type of wall. He explained his reasoning clearly and accurately. Looking at the payback period for this additional insulation is entirely appropriate.
After reading Wilson's article, I understood that the “payback” -- defined as the length of time it will take for the energy savings from the insulation to pay back the greenhouse gas emissions that will result from the use of that insulation -- for adding 4 inches of polyiso to the type of 2x6 wall under discussion is only 2.7 years, while the payback for adding 4 inches of XPS is 65 years. That's important information for green builders to know.
Not as bad, but still bad
Allison, this was a very useful approach. Thank you for continuing to look at this important topic. To my mind, which approach makes sense is project dependent. Wilson's approach is the more appropriate for a remodel project looking to add insulation to an existing wall. Your approach is probably more appropriate for many new construction situations.
Maybe part II will touch on this, but another approach would be to consider the payback for each additional "R" of insulation rather than breaking the wall into 2 parts. An interesting value to know would be at what point does adding an additional "R" exceed some payback threshold. If I understand it correctly, both your method and Wilson's are calculating the payback for a complete R45 section. The first "R" of that section will have a very short payback whereas the last "R" will be something a lot longer. Calculating the payback for the entire R45 may hide the fact that the last layer is actually a global warming deficit and that while the section as a whole is beneficial, the last layer is not!
Regardless of which calculation method is used, it is important to remember that all else being equal, a lower GWP is better. While the argument to avoid XPS and ccSPF may or may not be as strong as originally made, it is still valid.
why such a vendetta?
Allison,
Given all the possible things that you might choose to rail against these days, I can't figure out why Alex's article has gotten so much of your attention. Is there an audience you're playing to?
When the topic first arose most practitioners I know felt that Alex had done a service by pointing out that loading order, diminishing returns, and materials selection mattered not just with regard to ROI of energy savings investments, but also with regard to overall global warming impact of assemblies. I thought it was useful to learn the extent to which some materials and performance choices might be working against my overall climate impact goals, and that I should consider a broader range of calculations than I had been aware of.
Although I realize you've come to acknowledge some of the original article's inherent value, perhaps your overall vendetta should be against those who may have misused or misrepresented it, and not against the article itself.
There is no equivalence between MMBTU and GWP.
There is no equivalence between energy and global warming potential. Unless you are also calculating the GWP of the MMBTU saved against the GWP of the incremental HFC escape over similar time frames the entire argument is pure bullshit.
I'm not buying any of it, and here's why:
Not all MMBTU have the same carbon footprint, so how the hell do you know if the ~15-20% improvement for 10-20 years of the HFC blowing agent in say, 1.5lb XPS vs. 1.5lb EPS "saved" anything, or had any global warming "payback" AT ALL?
For a house heated with a mini-split in a light-GWP grid (say Quebec Hydro), it saves nothing at any thickness in any stackup and has no global warming payback ever. From a global warming perspective it's all pure loss over any time frame, at any MMBTU savings.
For a house heated with the same mini-split in a high GWP grid (say, coal fired West Virginia) you'd have to run the math on the actual stackups, climate, heat pump efficiency, and estimate the rate of HFC losses, then take a WAG at how rapidly the grid greens-up in that region (if ever.)
But MMBTU saved never translates directly into global warming saved- there is no equivalence there is a range, and a very LARGE range, and in homes heated by grid power it even changes year-on-year as the grid gets greener. Except on a near-zero carbon emissions grid (there are a few) an MMBTU of heat pump output saved in 2016 will not have the same global warming impact as an MMBTU saved in 2030 or 2050, yet those dates are well within the anticipated lifecycle of the materials.
If you make the model too simple, it also becomes too stupid. The real world is more complex. But enough with the MMBTU==GWP equivalence already, or state the paradigm cases with the real GWP of the energy savings made explicit.
From up here in the peanut gallery it's clear that if high GWP materials can be designed-out of the stackup (and they usually can), there is no point to taking the environmental hit, no math or modeling complexity required.
Missing real world data
There are very important data points missing in Allison's article: air leaks, thermal bridging and cost of different insulation materials. Presumably the reason many individuals chose to insulate between the studs is because it's cheap, even if it's not as effective as insulating outside the studs. This is the primary reason people do it with the fluffy stuff and it can't be ignored in the real world. So along comes the next owner and decides to improve the home with outside board insulation because the present insulation level does not suit his needs. Is there really a reason in the real world to reverse the order of insulation? Not to my mind. Houses are the biggest expense item most people will ever own. There will always be corners cut in that market just so individuals, especially first time buyers, will be able to get their foot (literally) in the door.
Yes, you can reverse the order to get a faster payback on global warming potential but is it ever done in real life? Not by anybody I know, though admittedly I don't know everyone. And it's definitely worth it to get outside board insulation just to eliminate air leaks as well as remove thermal bridging, something this article did not try to address. I would estimate that the average house would benefit much more in insulation value by removing thermal bridging and air leaks than Mr. Bailes has accounted for in his calculations.
reply to Daniel Beideck
Daniel, most of this discussion started with a peer reviewed paper by L.D. Danny Harvey, “Net Climatic Impact of Solid Foam Insulation Produced with Halocarbon and non-Halocarbon Blowing Agents”, Building and Environment 42(8): 2860-2879, 2007. That paper did what I think you are suggesting. Alex Wilson did a variation on that because some people had trouble getting their heads around the marginal analysis that Harvey did, but somehow that seems to have led Allison into a maze of further confusion.
Strange approach
The approach taken here is confusing and misleading. It looks at the net emissions savings relative to an uninsulated wall, approximated as R-2. Unsurprisingly, the energy savings, and thus the emissions and GWP savings, are huge, and are bigger than the GWP from any insulation material, over a reasonable lifetime.
The problem with that is that nobody is arguing that you shouldn't insulate your house at all because of the GWP of the blowing agents. They are instead arguing that you should choose a different insulation material, or that if you are for some reason stuck using high GWP insulation, that you shouldn't use too much of it.
From reading Allison's slides, it appears that he agrees that you should choose a different insulation material, and I expect the next part of this blog will clarify that. It's only unfortunate to have this post confusing the issue before the next one, I hope, clarifies it.
To me, the main takeaway from Alex Wilson's or Danny Harvey's analysis is that the GWP of the insulation material is not negligible, and is worth considering. Allison has made a lot of fuss, but seems to have come around to agreeing with that main point. And we have alternatives now: Lapolla 4G ccSPF with low GWP blowing agent, and a range of low GWP rigid alternatives, including polyiso, EPS and mineral wool boards. So there's not much tradeoff analysis needed--we just need to get the word out that there's a clear consensus to use those alternatives if you want to build with low climate impact.
Response to Charlie Sullivan
Charlie,
Thanks for your comments. I agree. I have been battling misleading graphs comparing various insulation methods with uninsulated assemblies for many years. Icynene used to distribute such graphs -- perhaps they still do.
In Comment #13 at the bottom of my article titled It’s OK to Skimp On Insulation, Icynene Says, I wrote (back in 2010), in regards to a document from the Icynene web site:
"In a series of bar graphs, the author of this document compares heat loss through a tent to heat loss through Icynene-insulated assemblies. But no one really cares about heat loss through a tent. If this wall was in a house, it would be illegal.
"If we're looking at, say, a ceiling in North Carolina, why not start, for purposes of comparison, with an R-38 ceiling instead of a tent? After all, that's the legal minimum. You can't go any thinner without breaking the law.
"Of course, the heat loss through the tent is 50 times more than through a code-minimum ceiling. This huge difference skews the graph and leads the reader to believe that the differences in the suggested options are trivial. They aren't. Compared to a code-minimum ceiling, the suggested assembly with 6 inches of Icynene loses twice as much heat. In other words, it's significantly worse than the minimum ceiling allowed by law. It only looks good when you compare it to a tent."
Allison's graphs aren't as misleading as Icynene's graphs, but some of the introduced confusion is the same. When discussing R-value effects, the starting point should always be a code-minimum house -- because a worse-insulated assembly is illegal.
Log in or create an account to post a comment.
Sign up Log in