

More Building Science


As the outdoor temperature drops on a cold day, there’s less heat in the air for the heat pump to pump indoors. And at one special temperature, the balance point, the capacity of a heat pump equals the heating load in the house. In my recent article about the three types of heat associated with heat pumps, I mentioned balance point but didn’t explain how you might go about finding it. Let’s do that today.
I’ll keep it simple. All we need are three numbers: the heating load of the house at the outdoor 99% design temperature, the heating capacity of the heat pump at 17°F, and the heating capacity of the heat pump at 47°F. Then we’ll make an assumption about a fourth number: the temperature at which the heating load of the house is zero. We’ll take that to occur at 65°F.
So now we have four numbers, two for heating load of the house and two for heating capacity of the heat pump. We can plot the two load numbers on a graph of load versus outdoor temperature. We’ll then put the two capacity numbers on the same graph.
Next, we simplify things and assume the relationship between load and temperature is linear and that the same linear relationship holds for capacity and temperature. Let’s see what such a graph might look like.
A New Jersey example
We recently did a load calculation for a client in New Jersey, and that example works well for illustrating how to find balance point. The outdoor 99% design temperature for their location is 17°F. The heating load for the main part of the house (~1,800 square feet) is a little over 15,000 BTU/hr. For this exercise, let’s look at a single-stage, fixed capacity heat pump with a nominal capacity of 18,000 BTU/hr.
Both the manufacturer’s data and the AHRI Directory give the capacities of this heat pump at the temperatures of 17°F and 47°F that I mentioned earlier. In this case, the capacities are 10,700 BTU/hr and 17,800 BTU/hr.
Plotting those numbers yields the following graph.
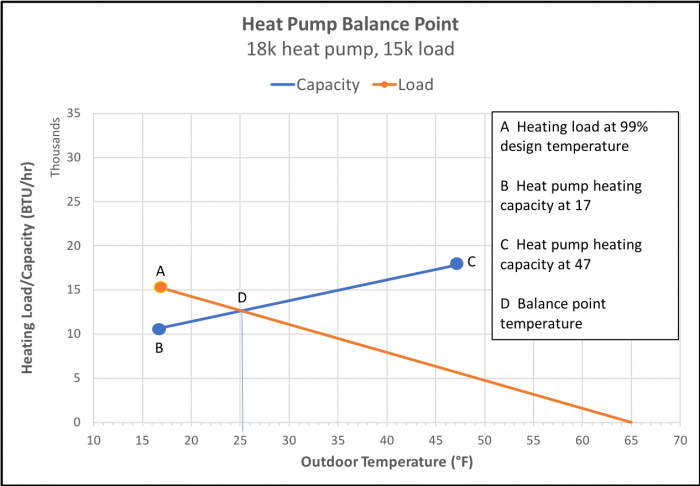
The orange line above is the heating load. As the outdoor temperature drops, the house needs more and more heat and the orange line rises. The blue line is the heating capacity of the heat pump. As the outdoor temperature drops, the capacity of the heat pump drops because there’s less heat to extract and pump indoors.
Where the two lines cross is the balance point. At that temperature, the heat pump is just able to keep up with the how much heat the house needs. The balance point temperature is about 25°F in this case.
The effect of equipment size on balance point
If instead of a heat pump with a capacity of 18,000 BTU/hr we put in a heat pump with a 30,000 BTU/hr capacity, the balance point will be different. Just thinking through this, you should be able to see that more capacity will result in a lower balance point.
The graph below shows how to find it.
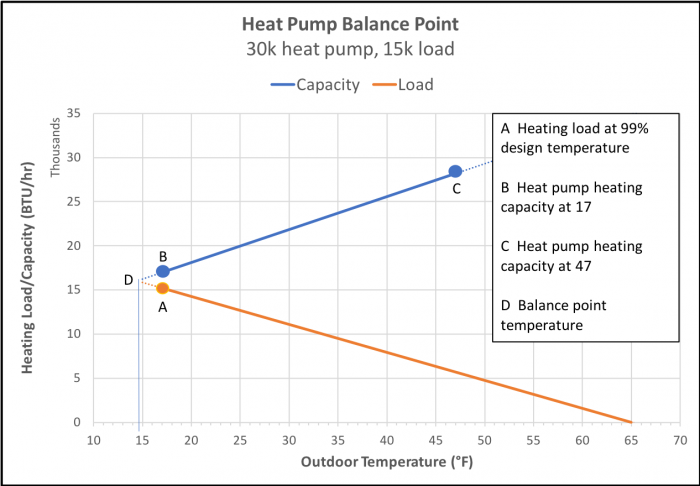
For this setup, the heat pump can provide all the heat needs down to and even a little below the design temperature. To find the balance point, we have to extrapolate the two lines to find the intersection, which is at about 15°F.
What I’ve done here is shown a simple way to find the balance point based on the heating load calculated for the house and the specifications for the heat pump installed or being considered. The actual balance point is probably a bit different.
Allison Bailes of Decatur, Georgia, is a speaker, writer, building science consultant, and the author of the Energy Vanguard Blog. You can follow him on Twitter at @EnergyVanguard.
Weekly Newsletter
Get building science and energy efficiency advice, plus special offers, in your inbox.


9 Comments
Neat. Two points that need clarification:
1)How do you get the "Heating load at 99% design temperature" for a home?
How do you apply this to a home that is more than 50 years old?
What happens if they added insulation to the roof?
2) How do you account for the cost of electricity vs alternate fuel. In other words when should you stop using the heat pump and start up the gas furnace?
Regards
Guy Lazure
[email protected]
Guy, those are great questions. First, the heating load comes from a Manual J load calculation. Here's an article I wrote about Manual J and Martin Holladay has written about it here as well:
Manual J Load Calculations vs. Rules of Thumb
http://www.greenbuildingadvisor.com/articles/dept/building-science/manual-j-load-calculations-vs-rules-thumb
There's a lot that goes into a load calculation and the accuracy of the results is limited by the accuracy of the inputs. The more assumptions you make, the more uncertain the results.
Your second question is about a different type of balance point: the economic balance point. The current article is about the balance of heating capacity and heating load but the economic balance point considers the fuel costs and tells you at what temperature it's best to switch over from one fuel to another. That's the subject of a future article.
Maybe I missed it but what was the simple way to establish point A (heat load at 99% design temp) on the graph?
Where did number come from? If it was a manual J calculation, getting that number is anything but simple for the average homeowner. An accurate calculation requires lots of data points be collected and enter into a computer program some of that data is little more than wild guesses. Finding someone to produce an accurate number is not easy or inexpensive.
In the real world every homeowner should lock out there electric heat they will know in the morning if last nights temperature fell below their systems balance point. It is important to set their system to lock out electric heat above the balance point. I found my thermostat was designed to provide maximum comfort by using electric heat starting at about 25°. I have yet to find my balance point I know it is below 8° but I see so few hours a year below 8°.
I do like the article my only problem is the word SIMPLE in the title.
Walta
Walter, I didn't say finding the heating load for the house was simple. There's a lot that goes into that calculation, and the Related Articles section above has a couple of articles on that topic.
Your point about locking out the supplemental heat, especially for temperatures above the balance point, is a good one. Since you've discovered that your actual heat pump balance point is below 8 °F, have you also discovered what the home's thermal balance point is? That's the temperature at which the heat first comes on. I assumed 65 °F in the article above, but that's higher than it really is in many homes, especially newer ones.
So just to confirm, the second image is what we should be aiming for, the balance point below the design temp?
I'd like to point out that the actual load and capacity lines won't be linear. Using five data points available for a Fujitsu, the line I got has a relatively flat part in the middle of the range (-5 to 17), with a higher slope at higher (17-47) and lower (-15 - -5) temperatures. So as long as your design temp is above 17F, your approximation is good. If your design temp is say 5F, it might not be appropriate to use the 17F and 47F data points and just extrapolate that line. In the case of the Fujitsu model I graphed, the extrapolation yields a value of about 12.5kBTU, whereas the actual spec for the unit at 5F is 15kBTU.
The heating load will change slope as the load approaches zero, due to the increased proportion of waste heat relative to the total load. But this is outside of the useful area of the graph, so it's of academic interest only.
Trevor, ideally you'd like the heat pump balance point to be lower than the design temperature. If that's the case, you can get by with little or no supplemental heat. The problem is that with conventional heat pumps, you're likely to end up oversizing the cooling side to achieve such a low balance point.
Mini-splits, however, are made to provide extra heat compared to cooling and they have variable capacity so it's easier to heat with a mini-split and not have any supplemental heat. In fact, I have a friend in Minneapolis who does just that. Yes, Minneapolis, Minnesota!
I knew someone would question my assumption about a linear relationship between heat pump capacity and outdoor temperature. You're absolutely right. It's not always linear.
My assumption about the home's heating load also isn't accurate, especially for new homes. By turning off the supplemental heat and seeing how well the home holds its setpoint on cold nights, you can get an idea of what the actual balance point is. Or you can monitor the supplemental heat and see at what temperature it comes on.
Re: finding Point A, it doesn't need to be the design load. Any two points determine a line, and we've already got one from the assumption of zero load at 65 F. If you have a single-speed furnace, you can get a second point with a quick experiment. Here it is:
1. Find the capacity of your furnace.
2. Record how long it's ON over the course of a couple of hours.
3. Load = (capacity) * (ON time) / (total time).
That load estimate, along with the outdoor temperature during the experiment, gives you the point you need on the load vs. temperature line. The experiment can also be repeated with different outdoor temperatures to generate more points.
For best results, do the experiment at night when heat gains from the sun, lights, appliances, etc. are small. If you do it on a really cold night, you're essentially measuring your design load. Don't adjust your thermostat during the experiment or for several hours beforehand.
Step 1 can usually be done by reading the model number off of your furnace and looking it up on the manufacturer's website. Step 2 can be done by noting when air is whooshing through your ducts, or by listening to your thermostat (often they make a little click when they trip on).
Can you also, look at the gas consumption vs average temperature for that period?
Can you explain how do you pick the balance point? i.e. Do you prefer to pick a balance point that is 5 degrees or 10 degrees lower than the design load temperature?
And now with hyper models, do we need to do that? or can we get the balance point closer?
Log in or create an account to post a comment.
Sign up Log in