

Image Credit: Energy Vanguard
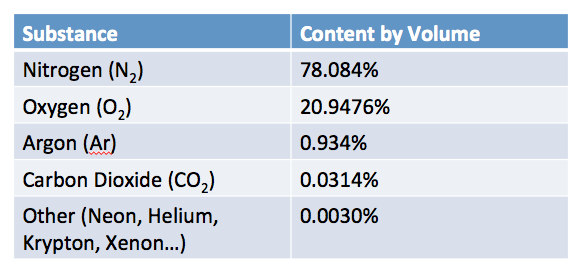
Image Credit: Energy Vanguard Dry air components by volume
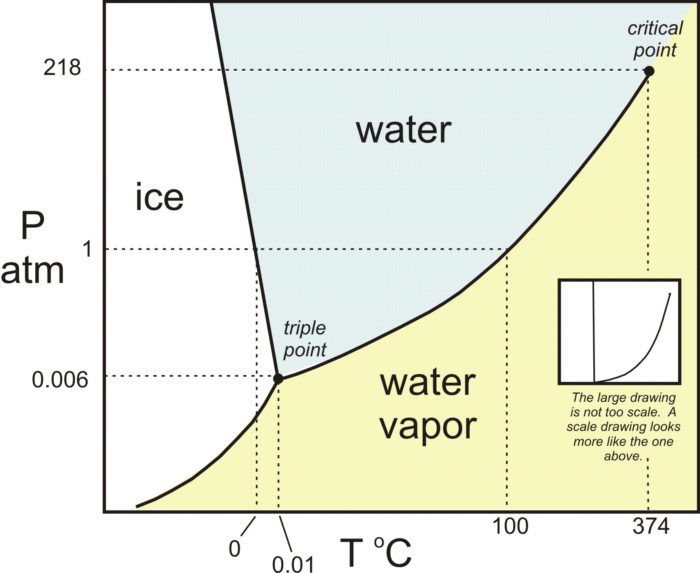
Image Credit: Energy Vanguard The pressure-temperature diagram for water from your high school chemistry class leads straight to the psychrometric chart.
Image Credit: Carleton College The psychrometric chart shows the states of water vapor under varying conditions of temperature and humidity.
Image Credit: Residential Energy by John Krigger Henry Gifford sporting a psychrometric chart T-shirt
Image Credit: Energy Vanguard
More Building Science


I have a confession to make: I’ve fallen in love with psychrometrics! After water itself, moist air has got to be the most interesting substance in building science. And the psychrometric chart, in all its many manifestations and with its multitudinous quantities, is a thing of beauty. Well, at least it is to me, and maybe it will be to you, too, after you get to know it a bit better.
What is psychrometrics?
One of the problems with learning this subject is that a lot of people jump straight into the chart without understanding exactly what psychrometrics is. Unless you’re an engineer, physicist, or meteorologist, your first encounter with the field of psychrometrics may have been the psych chart itself, with a little explanation of how it relates dry bulb temperature, relative humidity, dew point temperature, and “absolute humidity.” (I put that last term in quotes for a reason. Keep reading.)
My purpose here is to define the basic terms and put the field of psychrometrics in its proper context for you. The bible of psychrometrics, on which I’m basing a lot of what I’m telling you here, is the book, Understanding Psychrometrics by Don Gatley. Here’s his definition of psychrometrics:
Psychrometrics: the science that involves the properties of moist air and the processes in which the temperature or the water vapor content or both are changed.
Today I’m going to stick to covering the absolute fundamentals and save the explanations of the various psychrometric quantities and processes for a future article.
The two components of moist air
So that term, “properties of moist air,” is our focus, and it’s a term loaded with meaning and implications. Again, though, we need a definition before we can advance. What is moist air?
Moist air: a mixture of dry air and water vapor; also known simply as “air.”
Now, if we can just get a handle on those two things, we’ll be ready to begin.
First, we know that moist air is a mixture. It’s not a pure substance. The two components, dry air and water vapor, have different properties, with one thing in particular making this mixture of supreme importance in meteorology, air conditioning, and other areas. (Do you know what it is?)
Let’s take a look at the two components now. Dry air itself is also a mixture. The table in Image #2, below, shows the major components and a few minor ones, too.
Each of those elements and compounds has its own set of properties but there’s one important thing they have in common. It’s also the thing that distinguishes dry air from water vapor. Here it is:
The dry air components don’t change phase at the normal temperature and pressure ranges we deal with.
As long as the temperature is above about -100°C (-148°F), all of the dry air components exist in the gas phase only. They don’t condense out of or evaporate into the air.
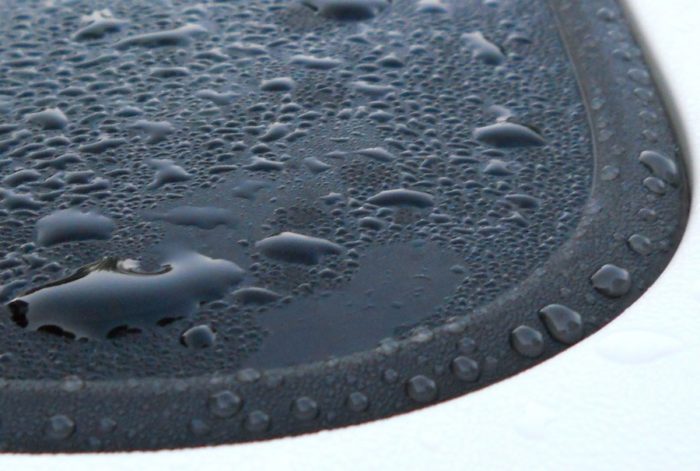
But that’s exactly what water vapor does. When the temperature drops at night, we wake up in the morning to find dew on the grass and on our cars. (Although you dry climate folks might have difficulty believing, that photo above is dew I found on the top of my car one summer morning.) When the sun hits the grass later in the morning, the dew starts evaporating and will have all returned to the air after a while.
The magic of water
Water has so many amazing properties. I recently wrote about the physics of water in porous materials and there I discussed all four phases of water. In the field of psychrometrics, however, our primary focus is on water vapor.
So water can go in and out of the vapor phase, thereby changing the properties of this stuff we call moist air. Air that has a very low content of water vapor might have only a few tenths of a percent of water vapor by mass. The most humid air that occurs naturally has about 3 to 3.5% water vapor by mass. That’s equivalent to an ungodly dew point of about 95°F, but we’re getting ahead of ourselves a bit.
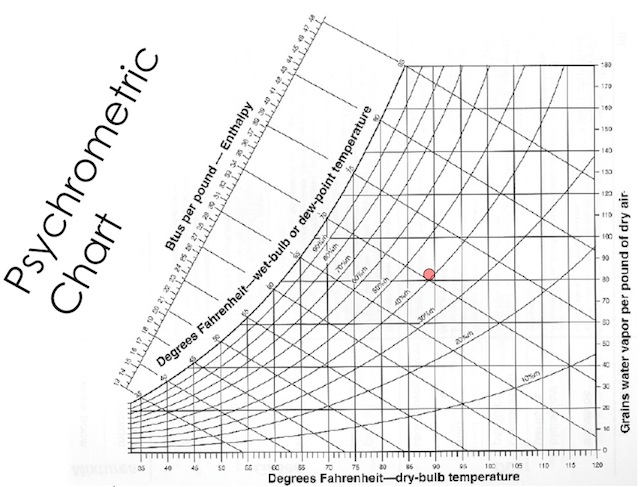
The point of psychrometrics is to understand what’s happening with the water vapor component since it’s the part of moist air that can undergo so many changes. As it turns out, a fellow by the name of Willis Carrier developed a tool that became enormously useful in the 20th century: the psychrometric chart (see Image #4, below). It allows us to locate the state point for a particular volume of air and then plot the changes it goes through as the conditions change.
From chemistry to psychrometrics
So where does the psychrometric chart come from? Let’s begin with the pressure-temperature diagram for water, shown as Image #3, below. In psychrometrics, we care mainly about the yellow region and what happens at the boundary between the vapor phase and the liquid or solid phases. That boundary in the pressure-temperature diagram is the same boundary you see in the psychrometric chart. It’s the 100% relative humidity curve, also known as the saturation curve.
In the yellow region, water vapor behaves pretty much like an ideal gas, so that and the pressure-temperature diagram take us back to our introductory chemistry class. The application to psychrometrics, as you might expect, is a bit more complex, but we won’t go deeply into the math in this series.
Now you’ve got the foundation for understanding the subject of psychrometrics. We’ve got the very basic definitions out of the way. In next week’s blog, we’ll take a look at the multifarious psychrometric quantities available and their definitions. (I’ve mentioned a few of those quantities already, but there are more… many more.) Then we’ll divide them into two groups: those that are measurable and those that must be calculated (plus a bonus dichotomy of those that are preferred and those that are discouraged). Following that, we’ll be ready to dive into some of the really fun stuff you can do with psychrometrics, like:
- Look at what happens when air passes through an air conditioner
- Find the result of mixing ventilation air with house air
- Figure out what we need to do to access “forbidden” regions of the chart
Once you’ve mastered all that, you, too, can sport a psych chart T-shirt, as Henry Gifford is doing in the photo below.
Allison Bailes of Decatur, Georgia, is a speaker, writer, energy consultant, RESNET-certified trainer, and the author of the Energy Vanguard Blog. Check out his in-depth course, Mastering Building Science at Heatspring Learning Institute, and follow him on Twitter at @EnergyVanguard.
Weekly Newsletter
Get building science and energy efficiency advice, plus special offers, in your inbox.


3 Comments
perhaps an opportunity
I *want* one of those shirts, but I think I recall Henry saying it
was a one-off custom job. Think of how many of those would get
snapped up at the right sort of conferences, though... is the
original silkscreen still extant??
It's probably worth mentioning that night-sky radiation also enters
the dew picture, making various upward-facing surfaces colder than
ambient on clear nights.
_H*
Thanks! Always been
Thanks! Always been intimidated by this topic, thanks for making it so accessible.
Small typo, need a minus sign in front of 100 degrees C
Response to Peter Rogers
Peter,
Thanks for catching the typo. It's been corrected.
Log in or create an account to post a comment.
Sign up Log in