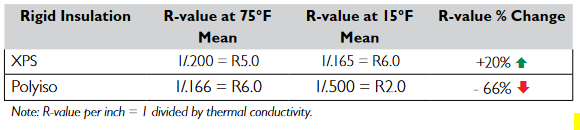
Owens Corning says Polyiso at 15°F is R-2, a 66% drop. Energy Vanguard says the loss is 25%, so still R-4.5. Who’s right?
Owens Corning and Energy Vanguard cite the same research by Building Science Corp, but present tremendously different conclusions.
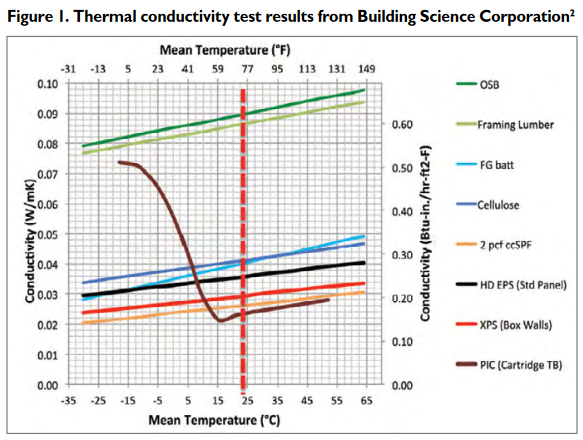
Owens Corning says at 15°F, polyiso’s R-value drops to “R2.0, representing a 66% loss in R-value.”
Energy Vanguard says “Polyiso, it turns out, can lose as much as 25% of its R-value when the temperature drops.” The graph in Energy Vanguard’s article is straight from a Building Science Corp brief summary, and it only has data down to 25 F, whereas Owens Corning references 15 F.

Owens Corning’s graph also comes straight from Building Science Corp’s main report on the study – pg 54 of the report, pg 61 of the PDF. (The graph is attached – I could not embed my screenshot or find the chart online outside a PDF.)
Why does one graph only display down to 25 F?
Why does the other graph display different results at 25 F? The graph displayed by Owens Corning shows at 25 F the conductivity is approx 0.45, in other words the resistance to conductivity is 1/0.45 = 2.22.
One graph appears to show R-5, the other R-2.22. Why the discrepancy?
What is the R-value of polyiso at 25 F? At 15 F?
Owens Corning’s article is from 2015:
owenscorning.com/NetworkShare/EIS/10019949-FOAMULAR-XPS-vs-Polyiso-Tech-Bulletin.pdf
Energy Vanguard’s article is from 2013:
energyvanguard.com/blog/big-news-the-r-value-of-insulation-is-not-a-constant/
Building Science Corp’s main report on this project is at insulationinstitute.org/wp-content/uploads/2015/12/Thermal_Metrics_Project_Report.pdf
Building Science Corp’s brief summary is at buildingscience.com/documents/information-sheets/info-502-temperature-dependent-r-value
Edit: Jon R just drew my attention to Fig. 3 in the brief summary, which appears to show average R11 for 2″ of polyiso even at 0°F (i.e. R-5.5/inch on average, presumably lower the further out it is). Does this clarify or confuse further? How can the researchers get both this result and R-2.22 at 25 F?
GBA Detail Library
A collection of one thousand construction details organized by climate and house part


Replies
Could there be some bias? How about a worst case of R5 at 0F?
https://www.buildingscience.com/documents/information-sheets/info-502-temperature-dependent-r-value
The graph shows an average from the different samples of R5 (by eyeball) at 25 F, with a severe downward slope, so it seems at zero F the R-value would be far below R5. The article mentioned that the National Roofing Contractor’s Association recommends assuming R-5.0 / in. when designing for cold climates, but the article gave no reason to think R5 would be the lower limit.
Did you see Figure 3? But the inconsistencies are a good question, maybe it was from measuring with a different warm side temperature?
Thanks! I had not. I edited my post in a few ways, including adding:
Edit: Jon R just drew my attention to Fig. 3 in the brief summary, which appears to show average R11 for 2″ of polyiso even at 0°F (i.e. R-5.5/inch on average, presumably lower the further out it is). Does this clarify or confuse further? How can the researchers get both this result and R-2.2 at 25 F?
(I found the Owens Corning graph is also directly from Building Science Corp, from the main research summary, and it appears to show 0.45 conductivity i.e. R-2.2 at 25 F.)
Not every inch of that polyiso is going to be 15f, as the polyiso is going to insulate itself and be warmed from the inside- very easy to imagine they're simply not making apples to apples comparisons. Talking about the performance of r-10 of polyiso where both sides are 15f is a completely difference scenario than, say, an actual building. I don't see quite enough info on either one to be sure what the modeled scenario is for either.
True true. I hoped they would provide the math for how to calculate the R-value of an actual installation of polyiso at different thicknesses in different extreme and average winter temperatures. A gradient - sounds to me like time to wake up Calculus skills.
The full summary is incredibly detailed with lots of photographs showing the setup, but too many for me to want to wade thru. Perhaps they show the test conditions were realistic. Perhaps not.
Take the common case of polyiso being used on the exterior of a 2x6 fiber filled wall.
What rated R value should I use if I want:
a) sheathing moisture accumulation similar to an exterior insulation that has a constant R value OR
b) whole year energy use similar to an exterior insulation that has a constant R value
I have no idea. It's not clear to me that any professional building scientist knows either.
Here is a link to a somewhat more technical article on this subject - It was written by the Dow Chemical Company which has an economic interest in promoting the use of their product (THERMAX) but that does not imply or prove it's inaccurate.
https://www.csiresources.org/HigherLogic/System/DownloadDocumentFile.ashx?DocumentFileKey=39ccb701-38b7-d04b-7de6-c50317e463e6
It definitely implies that Thermax does not have low temperature problems.
No calculus is really needed here, standard practice is to just use the median temperature, which is the "middle" value between the temperatures on either side. If you are 70F on the inside and 15F on the outside, then your R value is worked out at a temperature of 42.5F. The reason for this is that the entire thickness of the sheet of polyiso doesn't see the outdoor temperature, the temperature within the insulation gradually increases in temperature until it reaches the temperature of the "warm side". Note that if you have batts on the inside of the wall, you have to allow for the temperature gradient across those too.
Not all polyiso performs the same here, either -- some is better than others (as Dow shows with their Thermax product). The really poor performer in that graph was once referred to by Dana Dorsett on these forums as "world's crummiest polyiso", and may have been picked specifically due to it's very poor cold weather performance to make the data look a certain way.
If you de-rate polyiso to R5/inch, you're pretty safe. It's unlikely to ever get down to the ~R4.2/inch of EPS, so you'll always come out ahead with polyiso, and in in warmer weather you come out quite a bit better with polyiso.
Note that there are newer blowing agents coming into use that don't suffer from the "loses R value in cold weather" issue the way the previous generation of blowing agents did. Unfortunately, most manufacturers don't specify this, so you can't know what you're getting most of the time.
Bill