Trying to figure out seasonal range for solar energy hitting my PV array
My question is basically this: is there a reliable way to calculate the seasonal difference in maximum available solar energy for a particular latitude?
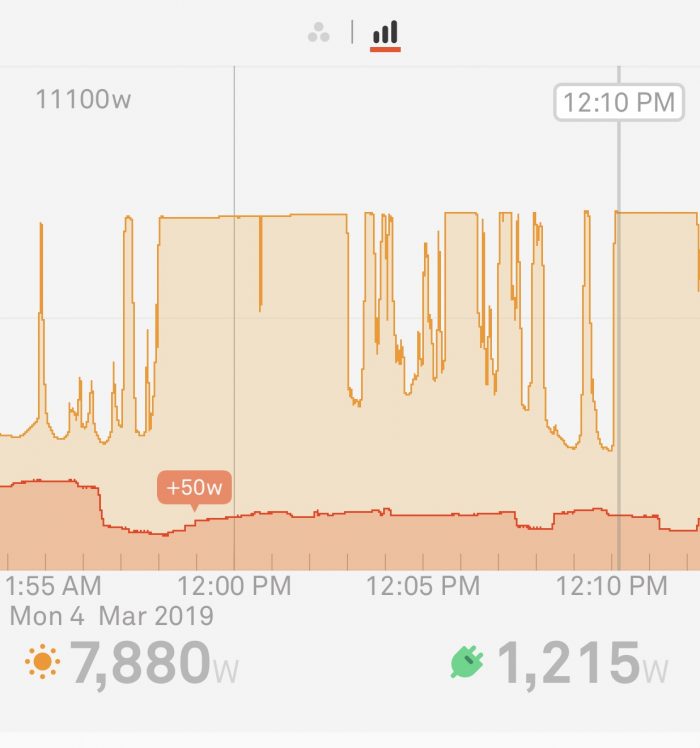
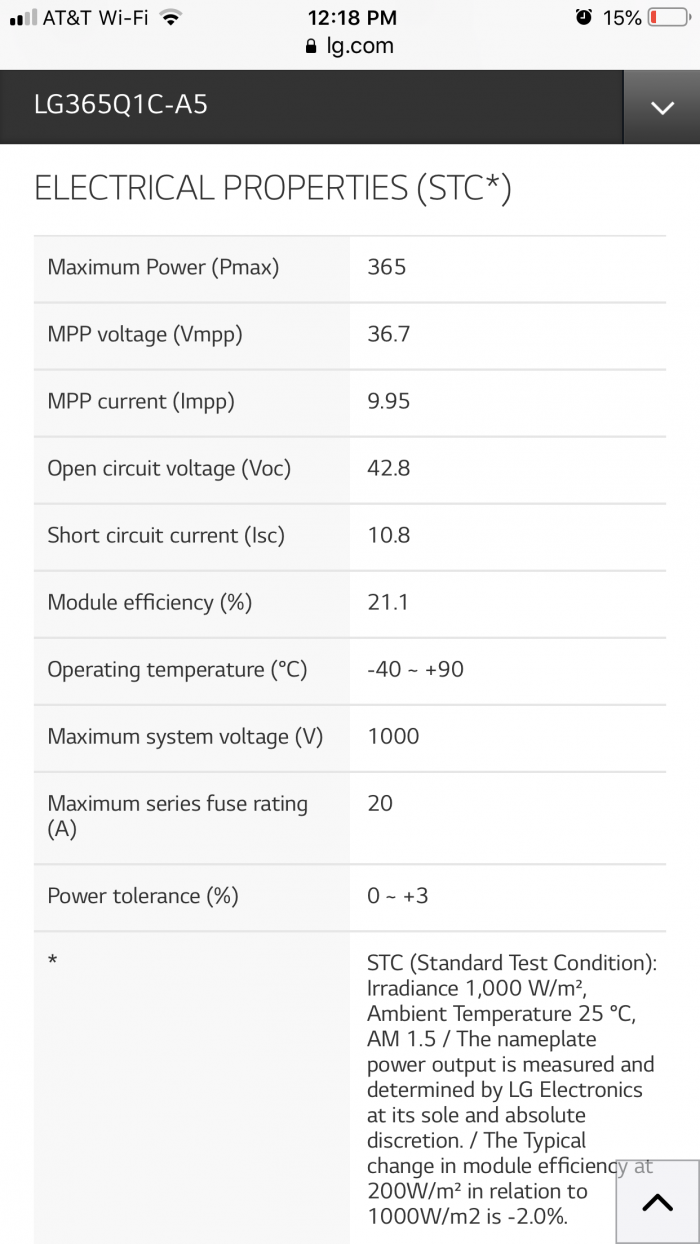
This past November I fired up my new array of twenty-eight LG 365-watt PV panels, for a total designed output of 10.2kW (https://www.lg.com/us/business/solar-panel/all-products/lg-LG365Q1C-A5 ). So the system has been running for over 3 months now, and on the sunniest days, production always tops out at around 7,880 watts. I’m at about 41-degrees latitude, and the system is mounted on a roof that faces SSW and is at an angle of about 40 degrees. I know that in winter the low angle of the sun should lead to more attenuation of solar energy, but I figured that I would at least see a little fluctuation in maximum output from month to month as solar angle changes; but on every single sunny day, the system has produced the same maximum output.
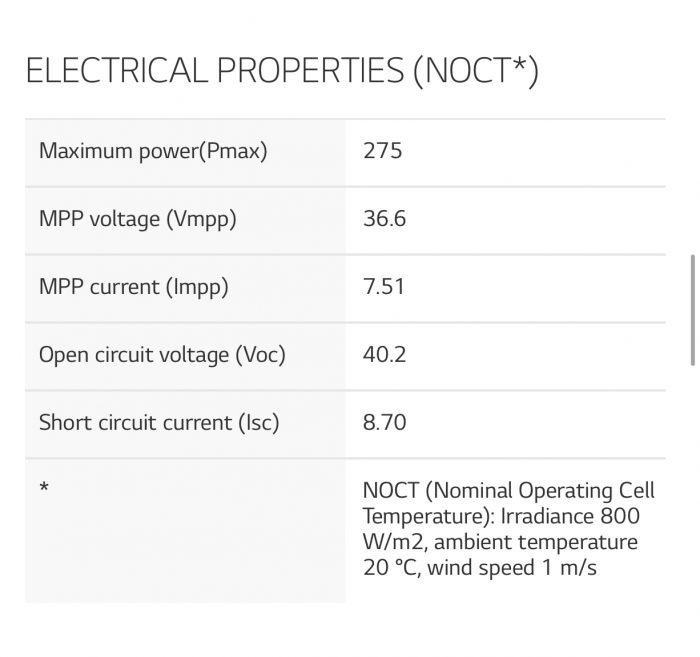
I realize that the output rating is based on ideal testing conditions (in a lab, I assume), and if you go by the Nominal Operating Cell Temperature rating, the rated output more closely represents what I’m seeing. I know that I can just wait until later this year to get the real answer to this question, but can I estimate if and how much more energy the system will produce in summer? Should it ever produce more than the max 7.9kW that I’m seeing? Or will it likely produce more daily power solely on the fact that there are more hours of sunlight in a day?
the main reason I’m asking, other than that I’m impatient and don’t want to wait for actual data, is that I was surprised how difficult it was to find detailed information about calculating seasonal production differences, even from the companies that produce and install photovoltaic equipment.
Thanks in advance for any light you can shed on the subject! 😉
Rob
GBA Detail Library
A collection of one thousand construction details organized by climate and house part


Replies
Your graph shows some type of clipping - probably the charge controller or grid-tie inverter.
This should be useful: https://pvwatts.nrel.gov/
Jon R,
Thanks! That’s exactly the type of calculator I was looking for.
I was wondering if there was some sort of artificial cap on production going on. If so, would you guess it would more likely on the system side or the utility company’s net-metering side?
I agree you’re hitting some hard limit in your system. I’m not sure the meaning of the numbers on that graph — I’m assuming the “7880w” is the wattage you’re getting from the solar panels. What I’d the “1215w” number? Is that wattage of AC load in the house? If you add those two together, you get 9,095w. Assuming a 0.95 power factor, which is awfully good, you’d be maxing out 40A 240v AC circuit. That might be your limit. 7880w on what I assume is a 36v solar system is about 220A, which doesn’t make sense as a limit (it’s not a standard size for anything).
I’m going to guess that you’re limited by something like the AC circuit ampacity on your inverter, but it’s difficukt to say without more info do you have a wiring diagram with circuit sizing (an electrical “one line”?) that you can share? With some more info, such as a diagram and the type of inverter you’re using, I might be able to determine what the bottleneck is.
Bill
Bill,
The 1215W is the load on my house, but it doesn’t add to the solar number—it’s subtracted from it. The two numbers are overlaid so that you see at a glance whether I’ve got net production or net demand, depending on which number is higher.
It's common in residential systems to size grid-tie inverters to where they end up clipping/limiting peak power throughput during the most intense light conditions in order to be more efficient at the average power levels. If the inverter is oversized to the point where it delivers 100% of the PV output at the most intense light conditions and temperatures it's conversion efficiency drops pretty dramatically when running only half-power out. Sizing the inverter so it only delivers 90% of the peak PV output turns out to deliver more net kwh due to the higher efficiency at lower than peak conditions.
Dana, would you happen to have a link handy to a solar inverter datasheet that has a graph of efficiency versus load? I’m curious how severe it derates the efficiency as load drops. There has been a lot of work in power systems design to up the average efficiency numbers over large range numbers. I’d expect in 80-94% efficiency over most of the load range (not extreme light loads). I’m a little curious since I work with power systems frequently, but not solar specifically.
In my regular work, the big datacenter UPS systems I spec are rated as 94%. At full load. Customers sometimes are disappointed when they learn that you’re stuck with the same 6% losses over the entire load range. With a 500kw unit, there is about 30kw going off as heat from the moment you turn the thing on.
Bill
At half-power out, most inverters are *more* efficient. It's an inverter cost issue - don't build for X watts when you rarely reach this point. Over-paneling somewhat is OK.
Yes, I contacted my installer and they did say it’s clipping exactly the way you described, Dana.
Rob, what exact inverter do you have?
Jon R,
The system is by Enphase, and I actually have a bunch of microinverters on the roof instead of one inverter at the service panel.
Jon,
It looks like you have their 290W micro inverters which is slightly undersized for the panels you have. It is common to over-panel solar setups when running a single inverter, it doesn't quite make as much sense with a microinverter setup especially with the low cost of inverters nowadays.
Your setup setup should still get good power, also as the weather warms up, your panel efficiency will drop which will bring it closer to the max rating of your inverters. If you indeed have the 290W inverter, then things are running well, I wouldn't worry too much about it.
If they are MPPT controllers that is what they do. Balance out the voltage and current to give a constant power output. To estimate year round solar input, look at radiation data for your area.
Rob,
It sounds like you've gotten good advice -- the "clipping" seems to be caused by your undersized inverters.
As you probably know, daily PV array output in summer is higher than in winter, but not because of peak array output (watts) -- it's due to the higher number of sunny hours per day (kWh). The highest peak array output (watts) happens on very cold winter days, when the sun is shining brightly and there are a few cumulus clouds in the sky that provide reflection. Snow on the ground also helps.
In hot weather, peak output (watts) will drop.