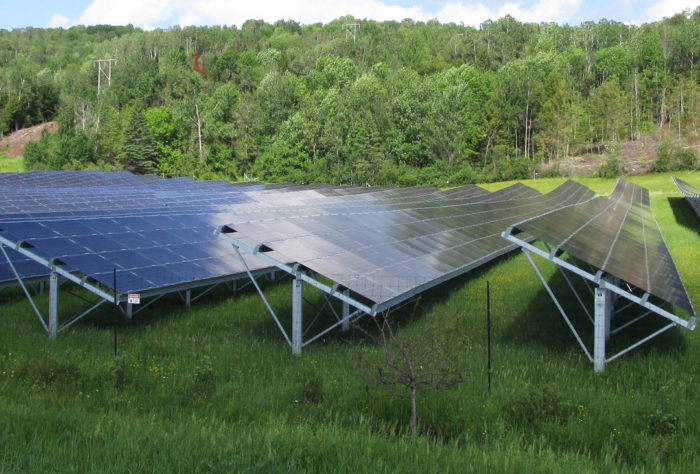
Image Credit: Martin Holladay
Current reporting practices by the U.S. Energy Information Administration and the California Independent System Operator show sharp increases in the amount of solar electricity produced in the U.S., but they overlook the output from the small, house-sized systems of nearly 700,000 solar customers.
The result, Greentech Media reports, is that solar production is probably 50% greater than previously thought.
In late June, the Advanced Energy Economy Institute issued its own report in which it said the EIA has consistently underestimated the amount of renewable energy coming online. But this new report makes the distinction between distributed generation and projects larger than 1000 kW AC, data which is captured on EIA’s Form 923.
“The information from these forms provided a fairly accurate view of U.S. generation when the electricity grid was made up almost entirely of central power plants,” Greentech Media reports. “But now the data gaps are growing.”
Distributed photovoltaic systems represent about 9.2 gigawatts-DC in capacity, or about 45% of total solar capacity, the report says.
Results of new research are ‘astonishing’
To reach this conclusion, the Solar Energy Industries Association, a trade group, and kWh Analytics looked at previously uncounted production from household-sited systems, what they call “behind the meter” systems.
“The results are astonishing,” Greentech Media reports. “We estimate that actual solar production is 50 percent higher than the previous best estimates of solar production. In the 12 months ending in March, solar energy systems in the U.S. generated 30.4 million megawatt-hours of electricity. EIA’s utility-only estimate for the same period is 20.2 million megawatt-hours.”
What do the numbers mean?
- Collectively, solar-generated electricity in the U.S. is enough to meet the annual demands of Hawaii, Rhode Island, Vermont, and Alaska combined.
- In California, Arizona, and Hawaii, solar now provides more than 5% of total consumption.
- U.S. solar production is more than what 16 individual states and the District of Columbia now consume.
The report notes that accurate information about renewables is “the lifeblood of effective regulatory and policy decisions at all levels of government.”
“Also,” the report adds, “it’s just nice to give full credit to the 174,000 solar workers in the U.S. who work every day to build our energy future. Every megawatt-hour counts. Every megawatt-hour from solar saves 172 gallons of water, displaces 1,500 pounds of CO2 emissions, and provides energy people can feel good about.”
Weekly Newsletter
Get building science and energy efficiency advice, plus special offers, in your inbox.







One Comment
Who is flying this plane?
Yikes! Where are we, in lower Slobovia? How does 50% of the solar production drop through the cracks in the floor? Well, lesson learned; do not pay attention to government stats, do your own inquiry and hang out on green sites like this one if you want any reliable info.
Log in or create an account to post a comment.
Sign up Log in