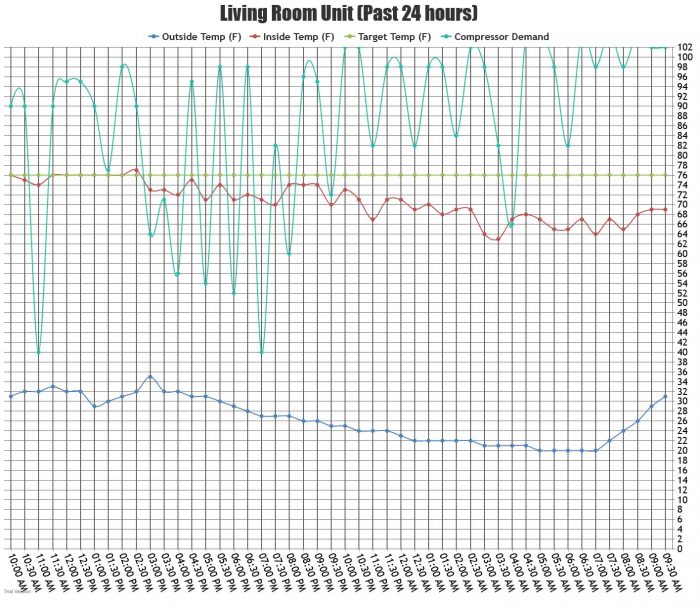
This is a graph of our multi-split performance (24 hrs)
Thought I’d share. I have a computer tracking the metrics of one of our head units. This is a snapshot of the last 24hrs, where it got very cold (for Alabama) overnight. This is the downstairs unit only. The upper floor has a regular split unit with forced-air gas furnace.
House stats:
– Built in 1892
– 2 story | 2300 sqft.
– Very little insulation in walls and attic
– Spray foam under the downstairs flooring
– 9.5′ ceilings in 2 rooms, 11.5′ ceilings in the other 2 rooms
– Daikin mini-split (36k VRF compressor) with 4 heads (12k/12k/12k/9k)
Commentary:
I cranked up 2 space heaters in the master bedroom at 7:00pm last night. That seems to have made the defrost cycles less intense, but there were still plenty. It got awfully chilly (63F @ 3:30am) in the living room, where these metrics came from.
Clearly, the issue here is not the mini-splits themselves, but the very poor thermal envelope of the house. It doesn’t get this cold very often in central Alabama, so I’m not too concerned about it. We will just use supplemental heat during the sub-freezing periods.
Not really a question, but just thought someone might find this real-world scenario interesting. If anyone has questions for me or want me to track a specific metric I’d be happy to.
GBA Detail Library
A collection of one thousand construction details organized by climate and house part


Replies
What are you using to monitor compressor demand? An electricty monitor I assume? I have 2 12k splits connected to an energy monitor and return/supply air temp probes. Its really amazing to watch them modulate on the energy monitor. It also makes running them to their max efficiency very easy. People always talk about short cycling
but I never see them do that. They seem to just modulate down to their min say 200 watts and stay there.
Here are some random screenshots of some data.
"What are you using to monitor compressor demand? An electricity monitor I assume?"
No, I'm taking the reading directly from the Living Room 12k head unit. There is a wifi dongle attached to it. You can poll it with a python library called pydaikin and it will give you a text/delimited dump of all the internal metrics of the inside/outside units. The "compressor_demand" value it gives is just a number. No idea what scale it's based off of, because sometimes it goes above 100.
This is what the data looks like after I run it through a parser to convert it to JSON:
{
"outside_temp": {
"N": "32"
},
"inside_temp": {
"N": "76.1"
},
"target_temp": {
"N": "76.1"
},
"compressor_demand": {
"N": "95"
}
}
I get the "outside temp" metric from a local station because the "outside_temp" value that the compressor reports is never accurate, and it doesn't even report one if the head being polled is off.
Here is a good snapshot of my downstairs unit at its lowest modulation.
Those are good graphs you have. What energy monitor are you using, and what temp probes if you don't mind sharing?
I am using and Efergy Engage hub and a acurite weather hub. The acurite has room/outdoor monitors that have wired temp probes. Here is the main display on each.
What are the units on the graph in the original post?
Bill
Daikin 12k Head, Model# FTXS12LVJU
Compressor is Daikin 36k, Model# 4MXS36RMVJU
Units though for the graph would be watts, kilowatts, maybe BTU?
This reminds me of my chemistry lab professor in college after a test. The class came into the lab one day, and he drew a graph with some numbers on the board and then stared at us all. After he’d made us uncomfortable enough with his glare, he smacked the board and loudly said in his thick German accent “WHAT IS?! IS COWS?! IS HOUSES?! UNITS, UNITS, UNITS!!!!”
I still remember his exact words, and he did have an important point: data is meaningless without the correct units of measure.
Bill
Ah, gotcha. Sorry about that.
The Y axis has dual meaning. For the temperature related plot lines it is Degrees F. For the compressor demand plot line it is just a straight number that Daikin's unit hands out when you poll it. I'm not sure what the meaning of it is, but it seems roughly analogous to a load percentage, except that it goes to 105, not 100.
Deleted