
Image Credit: Image #1: Craig Anderson
Image Credit: Image #1: Craig Anderson The HERS index for Craig Anderson's Canadian off-grid home. Heat loss: This document shows the amount of heat loss through various building components. A second version of the heat loss report, this one in French, offers more detail.
More Guest Blogs


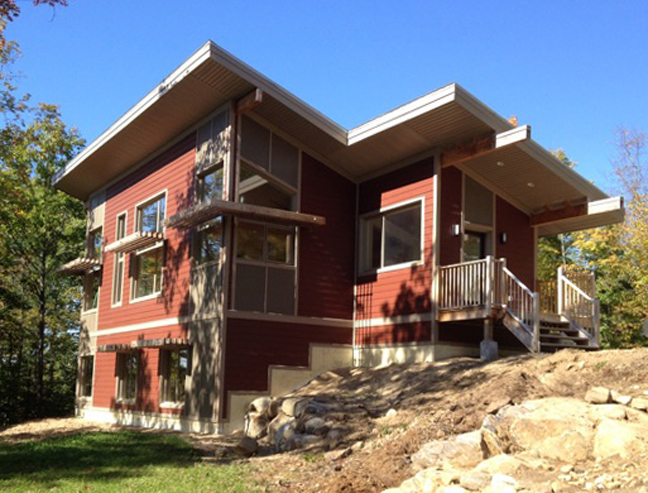
This is one of a series of posts by Craig Anderson describing the off-the-grid house he built with his wife France-Pascale Ménard near Low, Québec. Craig writes about the “Seven Hills Project” in a blog called Sunshine Saved. For a list of Craig’s previous posts, see the list of “Blogs by Craig Anderson” in the sidebar below.
We didn’t originally plan to do any formal energy modeling for our home. It actually only came about because of our relatively last-minute decision to seek LEED certification (to be covered in an upcoming post).
One requirement of the LEED process is to do an evaluation of the energy efficiency of a home, and this includes a fairly complete description of the building’s size, orientation, insulation, electrical appliances, etc. Using all of this disparate information and applying some standard assumptions about how a typical family uses a home (e.g., amount of hot showers, thermostat temperature, etc.), energy modelers are able to put together estimates of total energy use for a home.
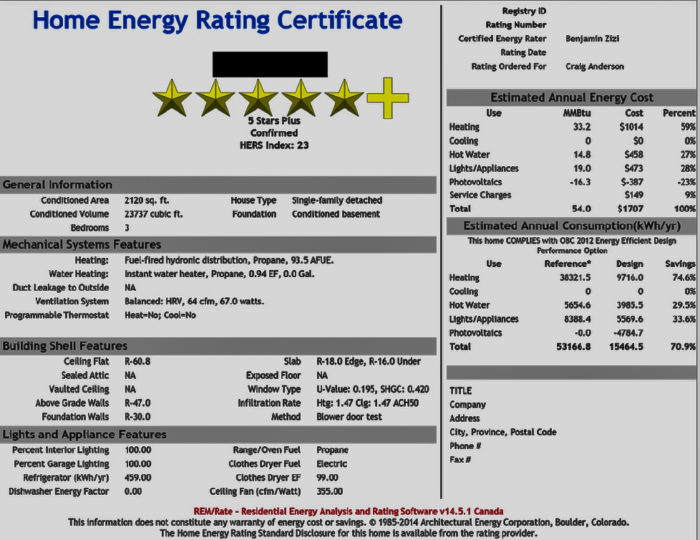
Image #2 (below) shows our “Home Energy Rating Certificate,” which provides the overall estimates, including the major details about the home, the systems, and expected energy use for all purposes. To boil a house down to a single number, many efficiency experts use the HERS Index. This is an evaluation of how much energy the modeled house uses as compared to a house that just meets the 2006 International Energy Conservation Code. As you can see in the certificate, our home achieved a HERS score of 23, whereas the reference home is always counted as 100.
While I won’t actually go through the calculation, this number is the percentage of energy that the modeled home uses as compared to the reference, with an adjustment for self-generation of power through things like our PV panels. By the standards of the typical homes being built, our place brings the external energy demand down by over 70%.
Comparing estimates with actual use
The rough breakdowns in energy use in kilowatt hours per year (kWh/year) are the figures that I find most interesting here. Our home is projected to use a grand total of 19,271 kWh/year, with 4,785 kWh coming from electricity produced by the solar panels, with the balance of 15,465 kWh provided by propane.
So how does this compare to our actual use for the year of 2015 (well, November of 2014 to November of 2015)? During that time, we used exactly 400 gallons of propane, for a total of 10,800 kWh of energy. The best measure of our solar electric use is actually the energy used by plug loads during the year, of 1,400 kWh.
This figure is actually a significant underperformance for our expected solar electric contribution for a couple of reasons. First, the batteries didn’t age well in their first year of use and don’t hold the amount of charge that they ought to; and second, more power was wasted than expected, as excess power cannot be saved if it is not used and the batteries are full.
I am putting together a system to use some of that excess power and will write about it once it is up and running. Needless to say, this puts our actual energy usage for the year at 12,200 kWh, much less than the model-predicted figure of 19,271 kWh. This is no surprise, as we are inhabiting the home only about half of the time, heating with wood when we are there, and probably taking fewer showers and using less technological toys than the average household. I would imagine that if we were there full-time that our actual energy usage would end up quite similar to the model’s projections.
Estimating heat losses
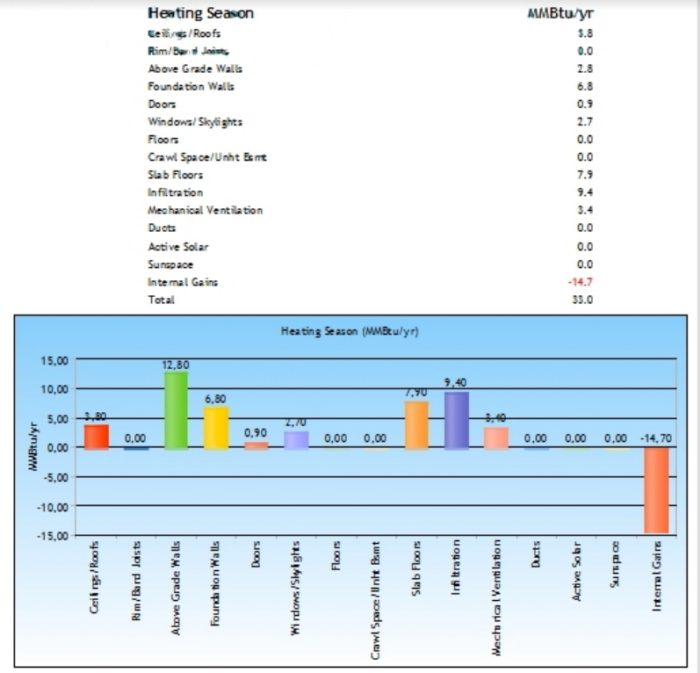
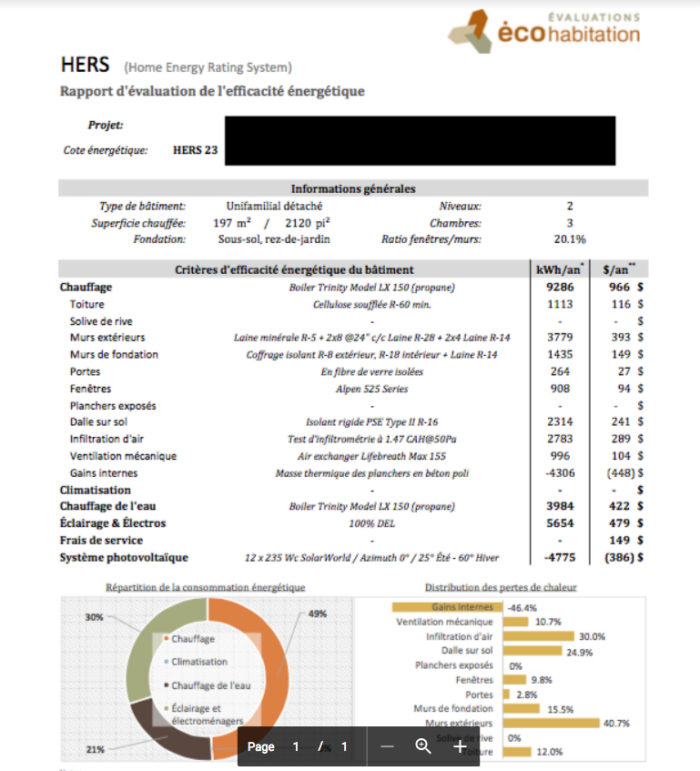
Another interesting set of details that came out of the modeling included estimates of heat loss through all of the different components of the building envelope. (See the Images #3 and #4 below: the first document in English, followed by a more detailed one in French. Some of the text in the English is wrong in the columns but correct in the chart).
To stay in kWh, I’ll work with the numbers from the French document. The total amount of heat needed from the active heating systems is 9,286 kWh (25% of the reference home). Part of the reason this figure is so low is due to the passive solar heat gain coming through all of the windows, to the tune of 4,306 kWh/year. Putting these figures together shows that more than 31% of the total heating needed for this home is accomplished by sun streaming in the windows.
I’ve taken just enough of a look at the passive solar heating literature to know that this is roughly as high as one should go with passive solar heating in a home unless one is willing to endure unwelcome overheating on warm sunny days in the winter and spring. Even with our place, I am finding that on bright sunny days in February and March, the upstairs of the house can exceed 30° Celsius (86°F) without the boiler or stove. I have actually found it to be good for the spirit to be able to open the windows and wear shorts on those blue bird days in February.
The other great thing about this heating breakdown is that it shows how much heat loss to expect from each component of the home. It is no surprise that the above-grade walls are the biggest component, since they make up much more surface area than any other part of the home. The walls would have been one of the most expensive parts of the home to upgrade, due to the amount of materials needed to cover that much area. The next highest contributor is air infiltration, at 2,783 kWh/year. When the house was half-complete, a blower door test showed that we had an air-tightness of 1.47 air changes per hour at 50 pascals, but as I outlined in this past, the house is probably tighter now and this heat loss lower than the model suggests.
The concrete slab and foundation walls, at 2,314 kWh and 1,435 kWh respectively, are probably the only places that I wish I would have added insulation. It would not have been that difficult or expensive to add thicker layers of rigid foam insulation, and I’m fairly sure that it would have been cost-effective to do this upgrade. I guess the one advantage of the current state of things is that the downstairs bedrooms are always cooler through the summer, making sleeping comfortable even on the hottest days of the summer without any air conditioning.
The power of solar
I just wanted to emphasize the usefulness of both active and passive solar in reducing the need for other, usually fossil fuel, sources of energy. If we were to eliminate the solar gain through the windows and disconnect the solar panels, the model suggests that we would need 23,230 kWh/year of power from propane, or 860 gallons. However, we already get 4,306 kWh of heat through the windows.
This model doesn’t account for the new solar panels added this fall, which together with the original installation would produce about 9,850 kWh of power per year. As I alluded above, I am in the middle of putting together a system to use up much of this excess electric power for space heating in the winter and domestic hot water heating in the summer. If I were able to put all of this excess capacity to use, this would mean our total needs from propane would drop to a projected 9,074 kWh. Considering that we already use much less energy than the model projects, my hope is to cut propane use for next year by one-third.
With continually improving technology and dropping prices, I can already see the day arriving, perhaps 15 or 20 years down the road, when it may be possible for us, and off-grid homes in locations like ours, to ditch the propane without breaking the bank. I’m looking forward to that day when I have all of my energy needs met from the sun shining down from above.
Close to the Passive House standard?
One of the original inspirations for our home was the Passive House standard. I’ve discussed this a bit in another blog post, but briefly, this is a standard for vastly reducing the energy needed to heat and power a home. That standard allows for 15 kWh/m2 of heating per year, which is quite difficult to meet for a single-family home in the climate here in Ottawa, Canada.
Even with all of the things that we did to build a better home, the model still suggests that we are at 47 kWh/m2 per year, about three times the amount allowed for Passive House certification. There are just a small handful of homes that have reached this certification in eastern Canada, and some of the professionals that I’ve spoken to around here think that this low heating requirement isn’t currently a reasonable goal in our climate. It is much colder here than in the area where these standards originated (mostly in Germany), where this number makes more sense.
Here, the local homes that are pursuing certification need to have walls roughly two feet thick. We felt that it made more sense here to build a “pretty good” house, and then make up a bit of the difference through such means as renewables. In the future, it is almost certainly going to become easier to meet and exceed the Passive House standard, as green building techniques improve and become more widely known, and as technological innovations continue to produce better products.
Weekly Newsletter
Get building science and energy efficiency advice, plus special offers, in your inbox.


6 Comments
Projected v. Actual
Is there any organized attempt at comparing actual energy use to projections, for any of the certification regimes? Obviously, occupant behavior and weather will cause actual energy use to vary from house to house and year to year, but isn't actual performance the only thing that really matters? For that matter, is there a rating system that only looks at performance and certifies after a year or five years of actual data?
re: Projected v. Actual
I believe the Living Building Challenge requires a year of actual data before final certification.
Living Building Challenge
It looks like LBC requires data, but also requires compliance with a long list of criteria that are likely to discourage almost everyone. I thought PH was complicated!
Stephen
Yeah, but you end up with a Living Building. That's got to be worth something.
To Malcolm
Malcolm,
"My framing's made of spruce
And all the spruce is dead,
My sofa's made of leather
And the leather's red and dead.
I've got the dead building blues..."
To Martin
Well done. I can't match that.
Log in or create an account to post a comment.
Sign up Log in