
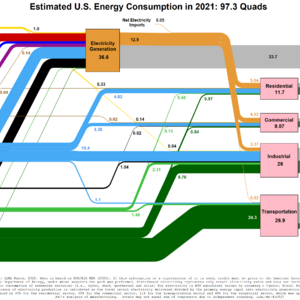
I love the U.S. energy flowcharts published by the Lawrence Livermore National Laboratory (LLNL) each year. The chart for 2021 came out in April, and you can see it in its full glory above. (Right click to download the full version.) The most eye-catching part of the chart for many people is the rejected energy, shown in grey. A common reaction is: “Wow! We sure do waste a lot of energy. We need to be more efficient.” Let’s talk about that.
Burning fuels
The first thing to understand is that the great majority of that rejected energy comes from burning fuels. We burn petroleum, gas, coal, and biomass to get heat. Then we use that heat to do work. Sometimes the work moves a vehicle. Sometimes it runs industrial equipment. And sometimes it runs a turbine that generates electricity.
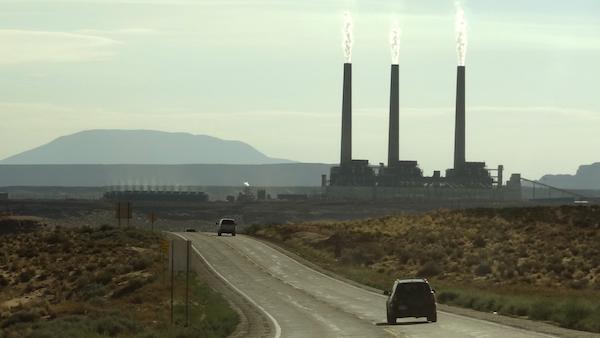
All of those processes involve a heat engine, a device that turns heat into work. Heat moves when there’s a temperature difference, and the second law of thermodynamics tells us that heat always moves from a warmer place to a cooler place. That means heat engines won’t work without a temperature difference.
The limit of heat engine efficiency
The thing about heat engines, though, is that there’s no way to convert all of the heat energy into usable work. There will always be heat leftover. That’s what makes up the bulk of that rejected energy you see above.

As it turns out, we’ve known this limitation for nearly 200 years. A French kid named Sadi Carnot figured out that there’s a limit on the efficiency of heat engines. He discovered the thermodynamic cycle that yields the maximum efficiency of a heat engine. His work is so important in thermodynamics that his maximum theoretical efficiency is called the Carnot efficiency.
In addition, he determined that the efficiency limit depends on only one factor: the temperature difference between the hot and cool sides of the heat engine. The larger the spread between the hot and cool temperatures, the more efficient the heat engine will be.
For the temperatures used in conventional electricity generation plants, about two-thirds of the energy in the fuel turns into rejected energy. Combined-cycle gas turbine power plants can achieve higher temperatures and get efficiencies up to about 60%. Automobiles reject about three-fourths of the fuel’s energy.
Can we do better?
We can wring a bit more water out of the fuel combustion sponge, as with combined-cycle gas turbines. Another improvement used in some places is what’s called the combined heat and power (CHP) plant, or cogeneration. It’s just a power plant located close enough to buildings that can use the lower temperature waste heat.
When you can take advantage of combined heat and power, a good portion of the rejected energy is no longer rejected. Yay! You send it to a hospital or office building or some other nearby facility that will use that heat for space or water heating. Unfortunately, combined heat and power is rare because most of the big electricity power plants are sited in rural areas, far from potential users of that waste heat.
Efficiency isn’t the solution to rejected energy
As long as we keep burning fuels, there will be a significant amount of rejected energy. That’s the nature of heat engines. There’s only one way to minimize that big grey block in the upper right part of the chart: Replace combustion with renewable energy.
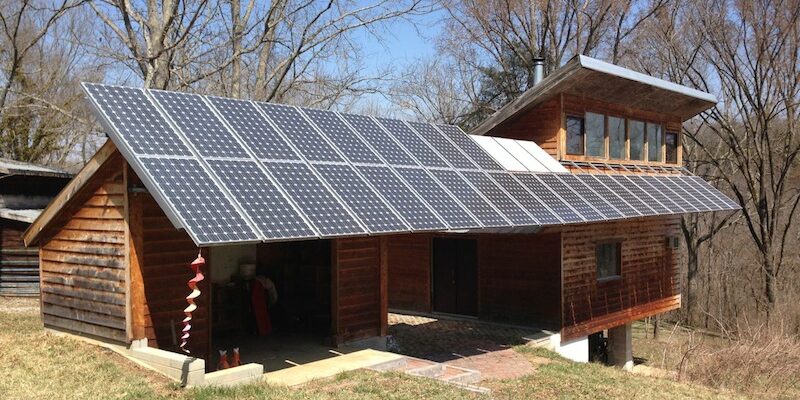
One benefit of that shift would be that we also get rid of the pollution and the carbon emissions that come with combustion. The rejected energy from combustion generally makes things worse. The rejected energy from solar and wind just does what it was going to do anyway.
A few last words
First, the LLNL chart is called an energy flowchart, but it’s really not a comprehensive look at energy. It’s a look at fuels. The subject of energy is much bigger and includes a lot of stuff that the chart here doesn’t touch. Second, a heat engine, which turns a temperature difference into work, can operate in reverse. When it turns work into a temperature difference, we call it a refrigerator or a heat pump. Third, there’s a whole lot going on in that chart. Further, you can get a better understanding of the trends in our fuel use by looking at how they’ve changed over time. I did that in a previous article on why it makes sense to go all-electric.
And finally, when you see all that rejected energy in the chart, I hope you’ll realize we can’t eliminate it just by being more efficient. It’s an unavoidable byproduct of combustion and heat engines.
_______________________________________________________________________
Allison A. Bailes III, PhD is a speaker, writer, building science consultant, and the founder of Energy Vanguard in Decatur, Georgia. He has a doctorate in physics and writes the Energy Vanguard Blog. He also has a book on building science coming out in the fall of 2022. You can follow him on Twitter at @EnergyVanguard.
Weekly Newsletter
Get building science and energy efficiency advice, plus special offers, in your inbox.








2 Comments
Related discussion around heat/work and hydrogen in this Fully Charged podcast:
https://fullycharged.show/podcasts/podcast-177-so-how-clean-is-hydrogen-actually-with-prof-david-cebon/
David Cebon is from https://h2sciencecoalition.com/members/david-cebon/
Allison this is a great article, providing useful talking points for renewables. Agree the NREL chart is a beautiful example of turning numbers into a very informative chart. Without that chart and your explanation, it would be difficult to understand the implications of all that data.
Log in or create an account to post a comment.
Sign up Log in