

More Green Building News


Warming temperatures have prompted changes in a climate-zone map used to set energy efficiency requirements across the U.S.
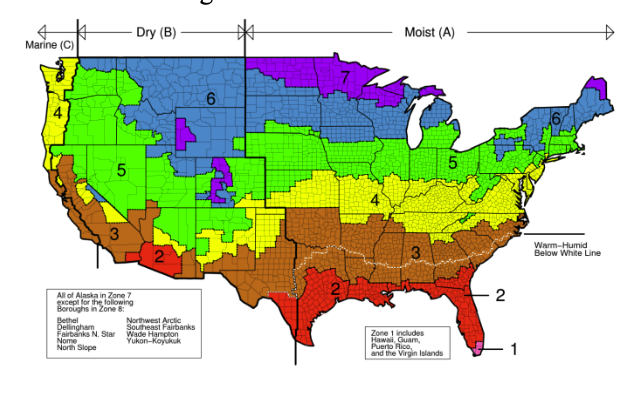
The familiar multi-colored map showing seven temperature zones in the continental U.S. is published by the American Society of Heating, Refrigerating and Air-Conditioning Engineers (ASHRAE). It’s used by the International Code Council (ICC) to recommend requirements for insulation, windows, and other features in low-rise residential buildings.
Acting on data related to a changing climate that has brought warmer conditions to much of the country, ASHRAE determined in 2013 that roughly 400 of the nation’s 3000 counties should be assigned to a new climate zone—mostly to a zone with milder conditions. ASHRAE also added a new climate zone, “0,” for very warm areas (there are no climate zone 0 locations in the U.S.).
The changes were picked up in commercial energy standards published by ASHRAE in 2018, but it wasn’t until this year that they were adopted in the International Energy Conservation Code (IECC) for low-rise residential buildings. It was the first time since 2006 that the climate zone map had been updated for the residential code.
The IECC and the International Residential Code (IRC) both are updated every three years. New versions of the model code must be adopted by state or local jurisdictions before they can be enforced.
The changes will mean different energy requirements in hundreds of U.S. towns and cities. When a county is reassigned from a cooler climate zone to a warmer climate zone, some energy efficiency requirements go down. That means less insulation in walls and ceilings, and windows and doors with lower efficiency ratings, for example. Changes also can mean less energy use, as when energy recovery becomes mandatory, or when windows are required to admit less solar energy.
In addition to using the revised climate zone map, the 2021 IECC also included a variety of changes in residential energy requirements. Insulation levels in attics went up to R-60 in climate zones 4–8, for example, while more energy-efficient windows are now required in many zones. Those requirements are listed in the Energy Efficiency Chapter of the IRC (Table N1102.1.3).
Changes date to 2013
Although the changes are just showing up in residential energy codes this year, the research behind them is eight years old. In a paper published jointly by ASHRAE and the International Building Performance Simulation Association in 2016, researchers described changes that had been adopted in ASHRAE Standard 90.1, which covers efficiency standards for commercial buildings.
Researchers said that adopting the new county-to-country zone maps results is an “overall weakening” of the commercial efficiency standards at the national level. “The impact at the state level can be dramatic,” the authors added, “as there are several states where large population centers are reassigned to a warmer climate zone.”
In explaining the reasons for the changes, the authors note that since the original maps were drawn the overall U.S. climate has warmed up, while much more information on the climate had become available for analysis.
Some states showed a very high percentage of potential new buildings whose code requirements would fall under a new climate zone designation. In Wisconsin, for example, more than 82% of new floor area went to a warmer climate zone. It’s hard to see the impact of these changes on a national map (shown above), but the country map (at the top of this column) makes them much more obvious. A few areas of the country got cooler, but most got warmer.
“The zone changes will clearly have substantial impact on energy code requirements in a number of states,” the report notes.
What about energy-use consumption because of the changes? Researchers modeled more than a dozen different kinds of commercial buildings—ranging from large office buildings to warehouses and mid-rise apartment buildings—to predict changes in energy-use intensity. Nationally, the change amounted to an increase of .18%.
“While this impact may appear small,” the report says, “some highly populous counties have been reassigned to milder climate zones and in such counties the decrease in stringency will be quite high. The reduction in stringency could also be higher for residential buildings and poses difficult questions for future adoption of codes.”
Michael Rosenberg, a research scientist at Pacific Northwest National Laboratory (PNNL), elaborated on the impact in an email. When the same building is subject to different code criteria once it’s been reassigned to a new climate zone, a variety of changes can occur, sometimes lowering energy use and sometimes increasing it. The impact will vary based on the zone and the building.
But that analysis covered commercial buildings, not single-family homes.
“PNNL has not analyzed the direct impact of the change in climate assignments on residential building energy use, as we have for commercial buildings,” Rosenberg said. “But it is likely the increase will be greater for residential buildings for two reasons. Residential buildings have lower internal gains and are more envelope-driven than most commercial building; and there are few, if any, code requirements in residential buildings that become more stringent in warmer climates.”
Looking ahead to improve resiliency
In a video call, officials at the ICC said that committees working on the 2018 version of the IECC considered adopting the new climate zone maps but ultimately decided not to. By the time the 2021 code was in development, things had changed.
“It’s certainly been an issue on peoples’ minds,” said Ryan Colker, the ICC’s vice president of innovation. “It felt like this was the time to do it. There were climate changes that needed to be recognized and this was the opportunity to go through that.”
Colker said efforts are underway to work with codes and standards development in a number of countries to develop strategies for dealing with climate change. They include Canada, Australia, New Zealand, Norway, Japan, Germany, and the Netherlands.
Each of the countries has surveyed architects, engineers, building owners, and climate scientists for ideas on how to address risks posed by climate change, such as snow loads, rainfall, and other environmental factors. An international effort called the Global Resiliency Dialogue has produced one report on how climate data is used in codes and standards, and expects to publish a second report next month on strategies for the future.
“I think we’re all pretty much in the same boat of recognizing that we need opportunities to address future-focused risk,” Colker said. “Canada is probably furthest along and has developed climate criteria for incorporation into their codes. But we’re looking at the strategy moving forward.”
Scott Gibson is a contributing writer at Green Building Advisor and Fine Homebuilding magazine. This post was updated on Oct. 29 to correct a county-by-county climate zone map of the U.S.
Weekly Newsletter
Get building science and energy efficiency advice, plus special offers, in your inbox.


8 Comments
This is interesting but not surprising. I imagine energy efficiency will remain important because energy required for dehumidification will increase as shoulder seasons expand into what would be winter or maybe not.
Warmer winters for most but also more unbearable summertime heat waves.
I see no reasons to slow down the trend toward well insulated, airtight houses with better windows.
Zones are a flawed system - does your neighbor 100' away across a zone border really need much more insulation than you? There should be further moves towards things like "R in attic must be HDD / 100". This is better for the environment and pocketbooks.
There's always some gray along borders. In any case codes are managed at the state/county level and zone designation is done at the county level.
How much more granular do u want it or does it really need to be?
I like the HDD/100 rule! Although maybe we need to do Max(HDD,CDD)/100. Or maybe it's sqrt(HDD^2+ 1.5 CDD^2)/100, weighting CDD at little more because of solar roof heating.
I hardly see where a 1 degree F change in temperature demands that we need to rethink our insulation strategies and energy efficiencies. Using Manual J to calculate your heating/cooling needs, how much difference is caused by a mere 1 degree difference in design temperature?
Our house in Lancaster Co, PA was in Zone 5 with bordering counties at Zone 4. It looks like Lancaster Co may now have been reclassified as Zone 4. In either case I do not regret my R10/20/40/60 (basement slab/basement walls/structure walls/ceiling) insulation strategy.
thanks for the info. Re: ICC, it sounds like too little and too late, given so many heat records broken in the last decade. Hope that ICC and others catch up and stay ahead of climate change.
Re: temperature increases: The average temperature increase may not seem like much, but the extremes have drastically shifted to higher temperatures, which is what kills people, increases energy costs and emissions, and crashes the grid. Plus, humidity will also be increasing in some regions, thus exacerbating the temperature increases.
FYI:
-- The CA Energy Commission recently updated its weather files to 2018, but has yet to address climate change over 30 year life cycle, let alone 100 yr life cycle of buildings.
-- the UK draft Future Home Standards and London's standards, include the use of future weather files to assess overheating and energy risks (the latter also addresses urban heat effects).
-- The BC Energy step code includes and overheating assessment method.
-- Several groups (IBPSA folks et al.) are developing extreme weather file methods to better capture peak cooling needs under recent climates., more so than using summer Design Year files.
Don't know if the ICC or Global Resiliency Dialogue have included the above examples.
For MORE INFO on the impacts of climate change on overheating and health risks in new and existing buildings, and how to prevent them:
see Phillips & Higbee, 2021. Adjusting for New ABNORMALS: Adjusting for Extreme Heat and Outages, 2021 EEBA annual conference (including of modeling of home in Bakersfield CA).
https://drive.google.com/file/d/1WYisfQgb-hpfkebFcBTiAsBLMIby3Ia-/view?usp=sharing
Salud,
Tom Phillips
Healthy Building Research, Davis, CA (CARB - Ret.)
a bit late for this article. Here is nice article from Yale U, describing in longitudinal terms that changes in the CZ maps
https://e360.yale.edu/features/redrawing-the-map-how-the-worlds-climate-zones-are-shifting
Log in or create an account to post a comment.
Sign up Log in