

More Building Science


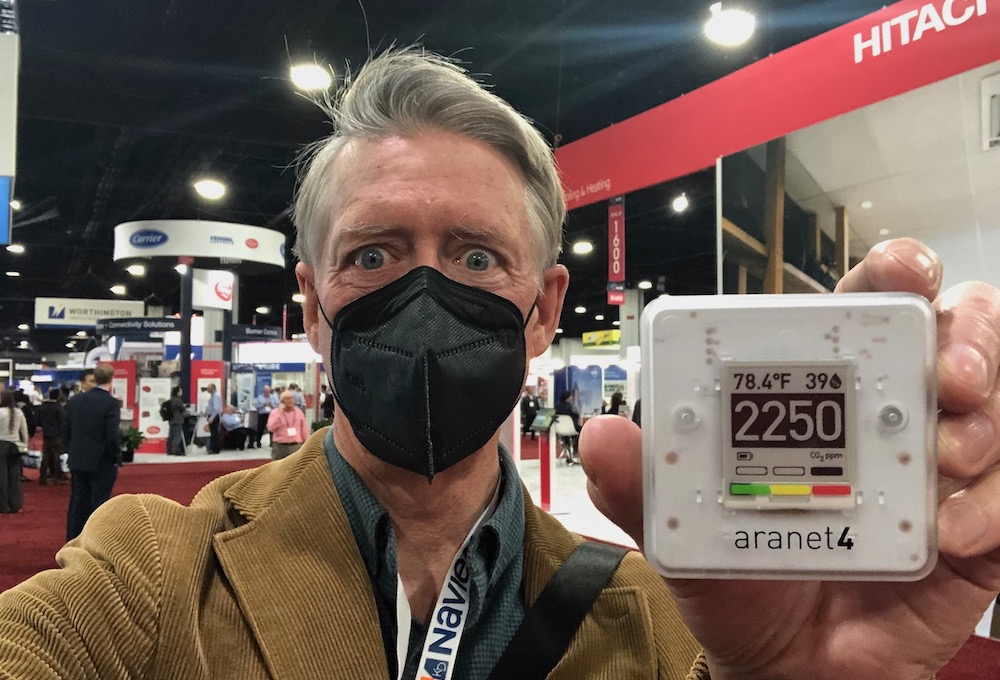
OK, it’s time to spell this out in black and white because there seems to be some confusion. Monitoring carbon dioxide (CO2), as I’ve been doing with my Aranet4 portable CO2 monitor* for the past couple of years, is a good thing. It’s not a perfect measure of indoor air quality. It’s more like a “Check engine” light on your car. So here’s the basic stuff you need to know to use carbon dioxide monitoring results wisely.
CO2 monitoring fundamentals
Carbon dioxide in indoor spaces comes mainly from people breathing or from combustion. If there’s no unvented combustion in a space, the carbon dioxide level is primarily from the exhaled breath of people. (Or sometimes animals. A contractor friend of mine once went to a house where the homeowner kept a donkey indoors. Really! And as weird as that sounds, it was NOT the worst part of the story.)
There’s a bottom end to the range of CO2 you’re likely to see when you carry a CO2 monitor with you to a restaurant, airport, or trade show. Indoor CO2 won’t be lower than the outdoor CO2. Since the Industrial Revolution, the outdoor number has been rising steadily because we burn a lot of fossil fuels. We’re now at about 420 parts per million (ppm) in the outdoor air. It does fluctuate some, but you won’t ever get an accurate measurement of, say, 300 ppm.
The upper end of the CO2 level you’re likely to see will be in the thousands of parts per million. I regularly see it in the 1500 to 3000 ppm range. The highest I’ve seen is over 7000 ppm. (More about that below.)
Consumer-grade devices like the Aranet4* (which costs ~$250) are surprisingly accurate. The Aranet4 specifications claim an accuracy of ±30 ppm, but for the kind of monitoring I’m talking about here, ±100 ppm (or even higher) is good enough.
Finally, carbon dioxide, CO2, is NOT carbon monoxide, CO. We exhale CO2, a colorless, odorless gas that’s harmless at normal concentrations. Incomplete combustion produces CO, a colorless, odorless gas that can be deadly at relatively low concentrations. You need a different kind of monitor to detect carbon monoxide.
It’s not the CO2
This week I went to the AHR Expo, a giant trade show for the HVAC industry. I brought my CO2 monitor with me and posted a couple of photos on LinkedIn showing the CO2 level in the exhibit hall. Some people thought the problem was the high level of carbon dioxide itself. But was it?
There’s been some research on the topic of the effect of elevated CO2 levels on people. Some of those studies have found that CO2 does affect our cognitive abilities. Others have found little to no effect. The ASHRAE position document on indoor carbon dioxide (pdf) says this:
Existing evidence for direct impacts of CO2 on health, well-being, learning outcomes, and work performance at commonly observed indoor concentrations is inconsistent, and therefore does not currently justify changes to ventilation and IAQ standards, regulations, or guidelines.
Using a CO2 monitor indoors isn’t about the CO2. It’s about what the CO2 level tells you. But before we get to that, there’s another thing it doesn’t tell you.
It’s not a measure of indoor air quality
The indoor CO2 level does not tell you how good or bad the indoor quality is. It doesn’t tell you which indoor air pollutants you’re being subjected to or what your risk level is. That’s because a CO2 reading tells you only one thing: the concentration of CO2 in the air being sampled by the monitor. But it hints at something else, and that’s where its usefulness lies.
With a high CO2 reading, the indoor air quality actually could still be pretty good. Why? Because good indoor quality results from a layered approach. Those layers include source control, airtightness, moisture control, filtration, and ventilation. The CO2 level gives you a hint about only one of those layers.
It’s a useful indicator
So what does it hint at? That would be the ventilation rate relative to the CO2 sources. Why is this important? Because ventilation is one of the layers mentioned above. It’s a dilution method that replaces indoor air with outdoor air. As long as the outdoor air is cleaner than the indoor air, the indoor air improves. Or at least it doesn’t get as bad as it would be without the ventilation.
The main concern that has driven people to start carrying CO2 monitors is the airborne transmission of infectious diseases. Scientists learned early in the COVID-19 pandemic that the coronavirus responsible for it spread mainly through the air. The particles expelled into the air by an infected person can carry a lot of the virus.
Ventilation is one way to reduce your risk of getting an airborne infectious disease. Since they’re particles, though, you can also get rid of them with filtration. The Corsi-Rosenthal box fan air cleaner is one way to do that.
CO2 levels tell a story
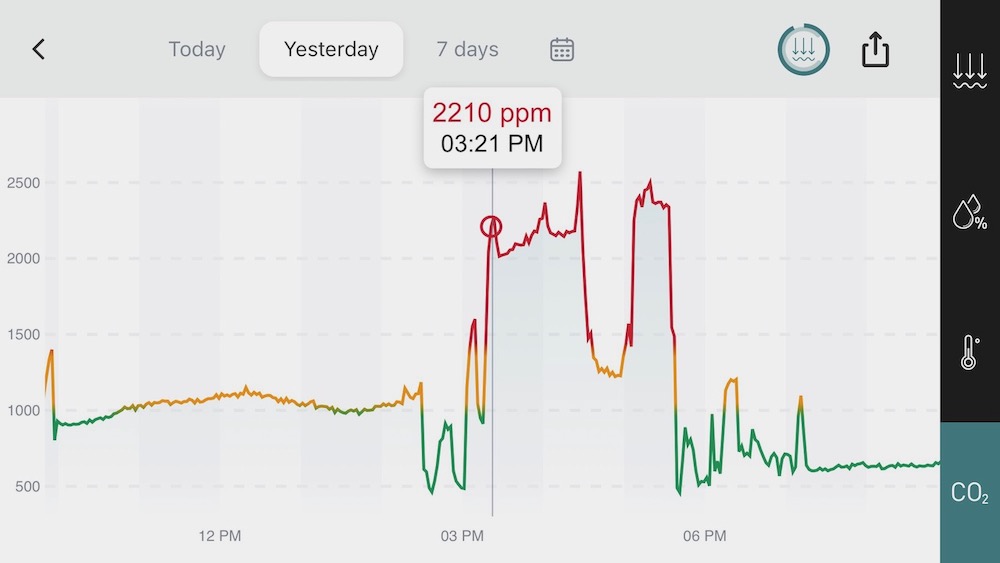
One nice thing about the Aranet4* is that it has an app that shows you a graph of the CO2 level over time. Below you can see my graph for Monday of this week, when I went to the AHR Expo in downtown Atlanta. Let’s look at the story being told here.
- Just before 10 am: The spike on the left is when I was driving to the office.
- 10 am to nearly 2 pm: In the office. Our CO2 usually hangs out in the 700 to 900 ppm range, but it was running a little higher that day.
- 2 to 3 pm: 500 to 1000 ppm when I was outdoors at the train station, then on the train, and then outdoors between the train station and the Georgia World Congress Center.
- 3 to ~3:20 pm: In the lobby and registration area. Not a high density of people in that area, and the CO2 level was between 1000 and 1500 ppm.
- 3:20 to 5:30 pm. In the exhibit hall, the CO2 spiked up to a high of nearly 2600 ppm. The dip in there between 4:30 and 5 pm was when I went with Michael Ridler and Robert Bean to do an interview in the lobby area. Even there, though, the CO2 level was still above 1000 ppm.
- 5:30 to end of day: Train back to office, in the office for a bit, car trip home, and then home for the evening.
The important takeaway here is what the general CO2 levels were in different places. Above 1000 ppm means the ventilation isn’t keeping up the CO2 output very well. The indoor air quality may still be OK, but if anyone there is sick with something that transmits through the air, your risk of getting sick increases. When it’s above 2000 ppm, your risk is even higher.
One way to think about this is in terms of rebreathed air. The higher the CO2 level, the more air you inhale that recently came out of someone else’s lungs. I wrote an article showing engineer David Elfstrom’s spreadsheet correlating CO2 level with percent of rebreathed air. At 2500 ppm, for example, that model predicts that 5.5% of the air you inhale is rebreathed air. Don’t take that number too literally, though. Instead, think of it as an indicator.
Context matters
Another important factor in all of this is the setting. The graph above shows really high CO2 levels at a crowded indoor event. If you’re alone at home with high CO2 levels, you probably don’t need to worry as much. Yeah, you could use more ventilation if your CO2 is hanging out above 1000 ppm, but you’re less likely to get COVID or the flu.
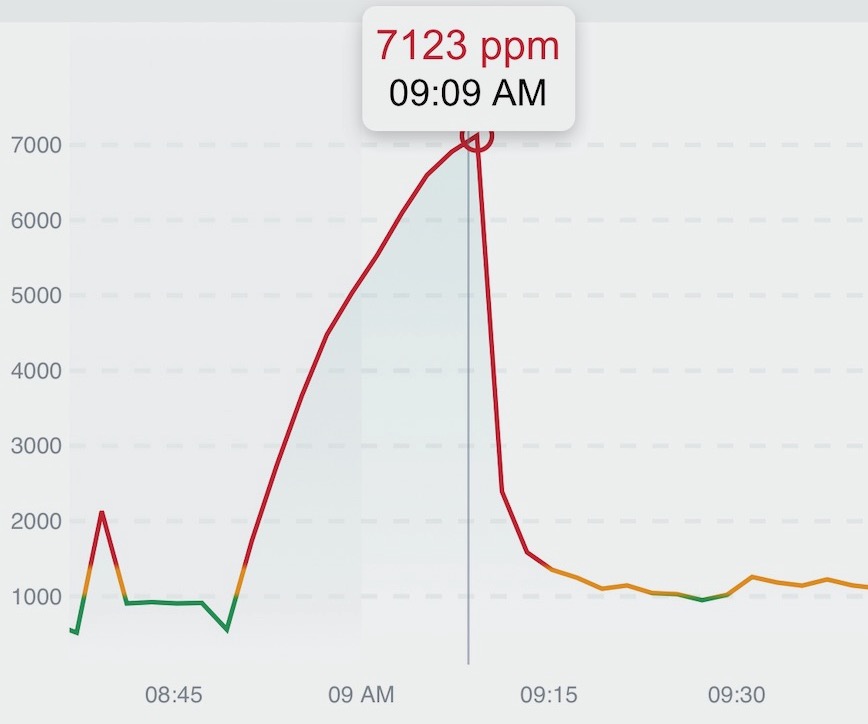
Here’s another CO2 graph, this one showing the highest CO2 level I’ve measured. After a conference last summer, four of us drove to the airport in a rental car for about an hour. We sat there talking for a while when I remembered my Aranet4 and looked at it. I was shocked to see we were over 7000 ppm. The air conditioner somehow got switched to recirculate, so there was a whole lot of rebreathing going on there for a while.
Another place where the carbon dioxide level goes and stays above 1000 ppm is on commercial flights. You’re packed into a long metal tube with a bunch of other people, breathing recirculated air with little fresh air added to it. But filtration on a plane is pretty good. Unless you’re sitting close to a sick person, you’re probably OK without a mask.
The sum and substance is simple: Watching indoor carbon dioxide levels is like keeping an eye on the “Check engine” light on your car. It doesn’t always mean something is wrong, but it does mean you probably ought to do something.
________________________________________________________________________
Allison A. Bailes III, PhD is a speaker, writer, building science consultant, and the founder of Energy Vanguard in Decatur, Georgia. He has a doctorate in physics and is the author of a popular book on building science. He also writes the Energy Vanguard Blog. You can follow him on Twitter at @EnergyVanguard.
Weekly Newsletter
Get building science and energy efficiency advice, plus special offers, in your inbox.


4 Comments
Allison,
Great stuff! Straight to the reference folder.
Thanks, Malcolm!
CO2 often gets used as a proxy for air-quality, so it was very useful to get a good explanation for when that works and what the limitations are.
Alison, great article as usual :-) This time though, you're preaching to the choir!
On the commercial side, Co2 sensing and demand ventilation has been pretty usual fare for some time, and we used a few relatively inexpensive ($350 or so) 24 volt wall mount Co2 sensor/relays to interface with our building HRV systems as part of an extensive energy retrofit. The system worked great, and my staff got used to checking the color coding on the LED display to check on "air quality" quite often.
On the home side, I've been using an Ecowitt WH45 (PM25 & PM10 & CO2) which offers free web based graphing, but more importantly integrates with the home automation system. This in turn controls the HRV ECM fan profiles to vary delivery by 50, 65, 75, and 90 CFM, and if zero occupancy, will turn the system off altogether for a few hours. Having PM25 numbers along with Co2 results in some interesting observations, including the "hazards" of my girls using hair spray which bumps numbers every time they use it. This unit unfortunately does not monitor VOC as that would a nice addition to the system.
These technologies, which are relatively new to the market in consumer flavour, offer some very interesting mechanisms to further refine energy savings. In our zone 7a winter low temps, lowering demand cuts power use by the ECM fans by about 80%, increases exchanger heat efficiency (about 10% increase from 90 to 50 CFM), and also cuts the make up heat system power use by nearly 50%.
With so much attention being focused on air quality, these sensors make designing a reactive ventilation system relatively simple, and minimise energy use doing it. It's a pretty exciting time to be a building science enthusiast :-) Ecowitt has a variety of sensors that can provide data to the house automation hub as you'll see by the attached pic. The web interface graphs all of it so you can correlate inside/outside RH for example when looking at C02 levels with ventilation rates. Very cool stuff.
Log in or create an account to post a comment.
Sign up Log in