

More Building Science


You may not want to think about this but every time you inhale, you’re breathing in air that came out of someone else’s lungs. One of my favorite ventilation quotes drives this point home. In a book titled Ventilation and Heating from 1893, John Shaw Billings wrote:
Most civilized men and women are unwilling to put on underclothing that has just been taken off by another person or to put into their mouths articles of food or drink that have recently been in other people’s mouths but they take without hesitation into their lungs air that has just come from other people’s mouths and lungs or from close contact with their soiled clothing or bodies.
Carbon dioxide to the rescue
How much of each breath you take in is “rebreathed” air? The amount of carbon dioxide (CO2) in indoor air can be a good indicator of how much air you’re rebreathing. The outdoor CO2 level is about 400 parts per million (ppm). The indoor level is the outdoor level plus whatever accumulates indoors from any carbon dioxide sources there. The two primary CO2 sources indoors are combustion and breathing.
If no one smokes indoors at your house and your combustion appliances, if any, are vented to the outdoors, then your main source of indoor CO2 is people. Our lungs are finely tuned gas-exchange organs, taking in oxygen and releasing carbon dioxide. And they do so at a regular rate because CO2 isn’t just a waste product from our metabolism. It’s also used to keep our blood slightly on the alkaline side of the pH scale (7.40 ± 0.05), and that requires not releasing too much or too little. That regularity makes it possible to correlate CO2 level with rebreathed air, which we’ll come to in the last section below. But first, let’s talk about indoor CO2 levels.
Monitoring CO2
Indoor air quality is a much bigger issue than monitoring a single component of the indoor air. Carbon dioxide, however, can play an outsized role in helping to achieve good indoor air quality, especially in regards to COVID-19. Moreover, measuring the CO2 level in indoor environments that you spend time in outside your home can give you an idea of the degree of risk of aerosol transmission of COVID-19 in that space.
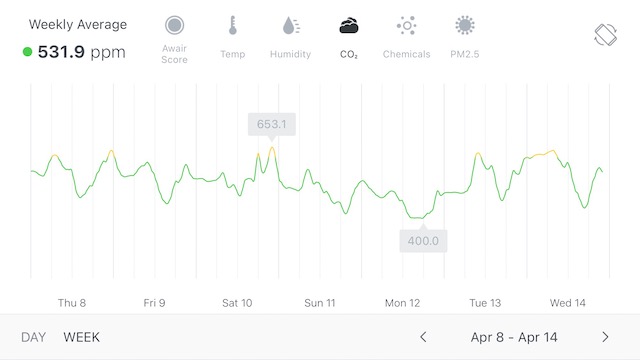
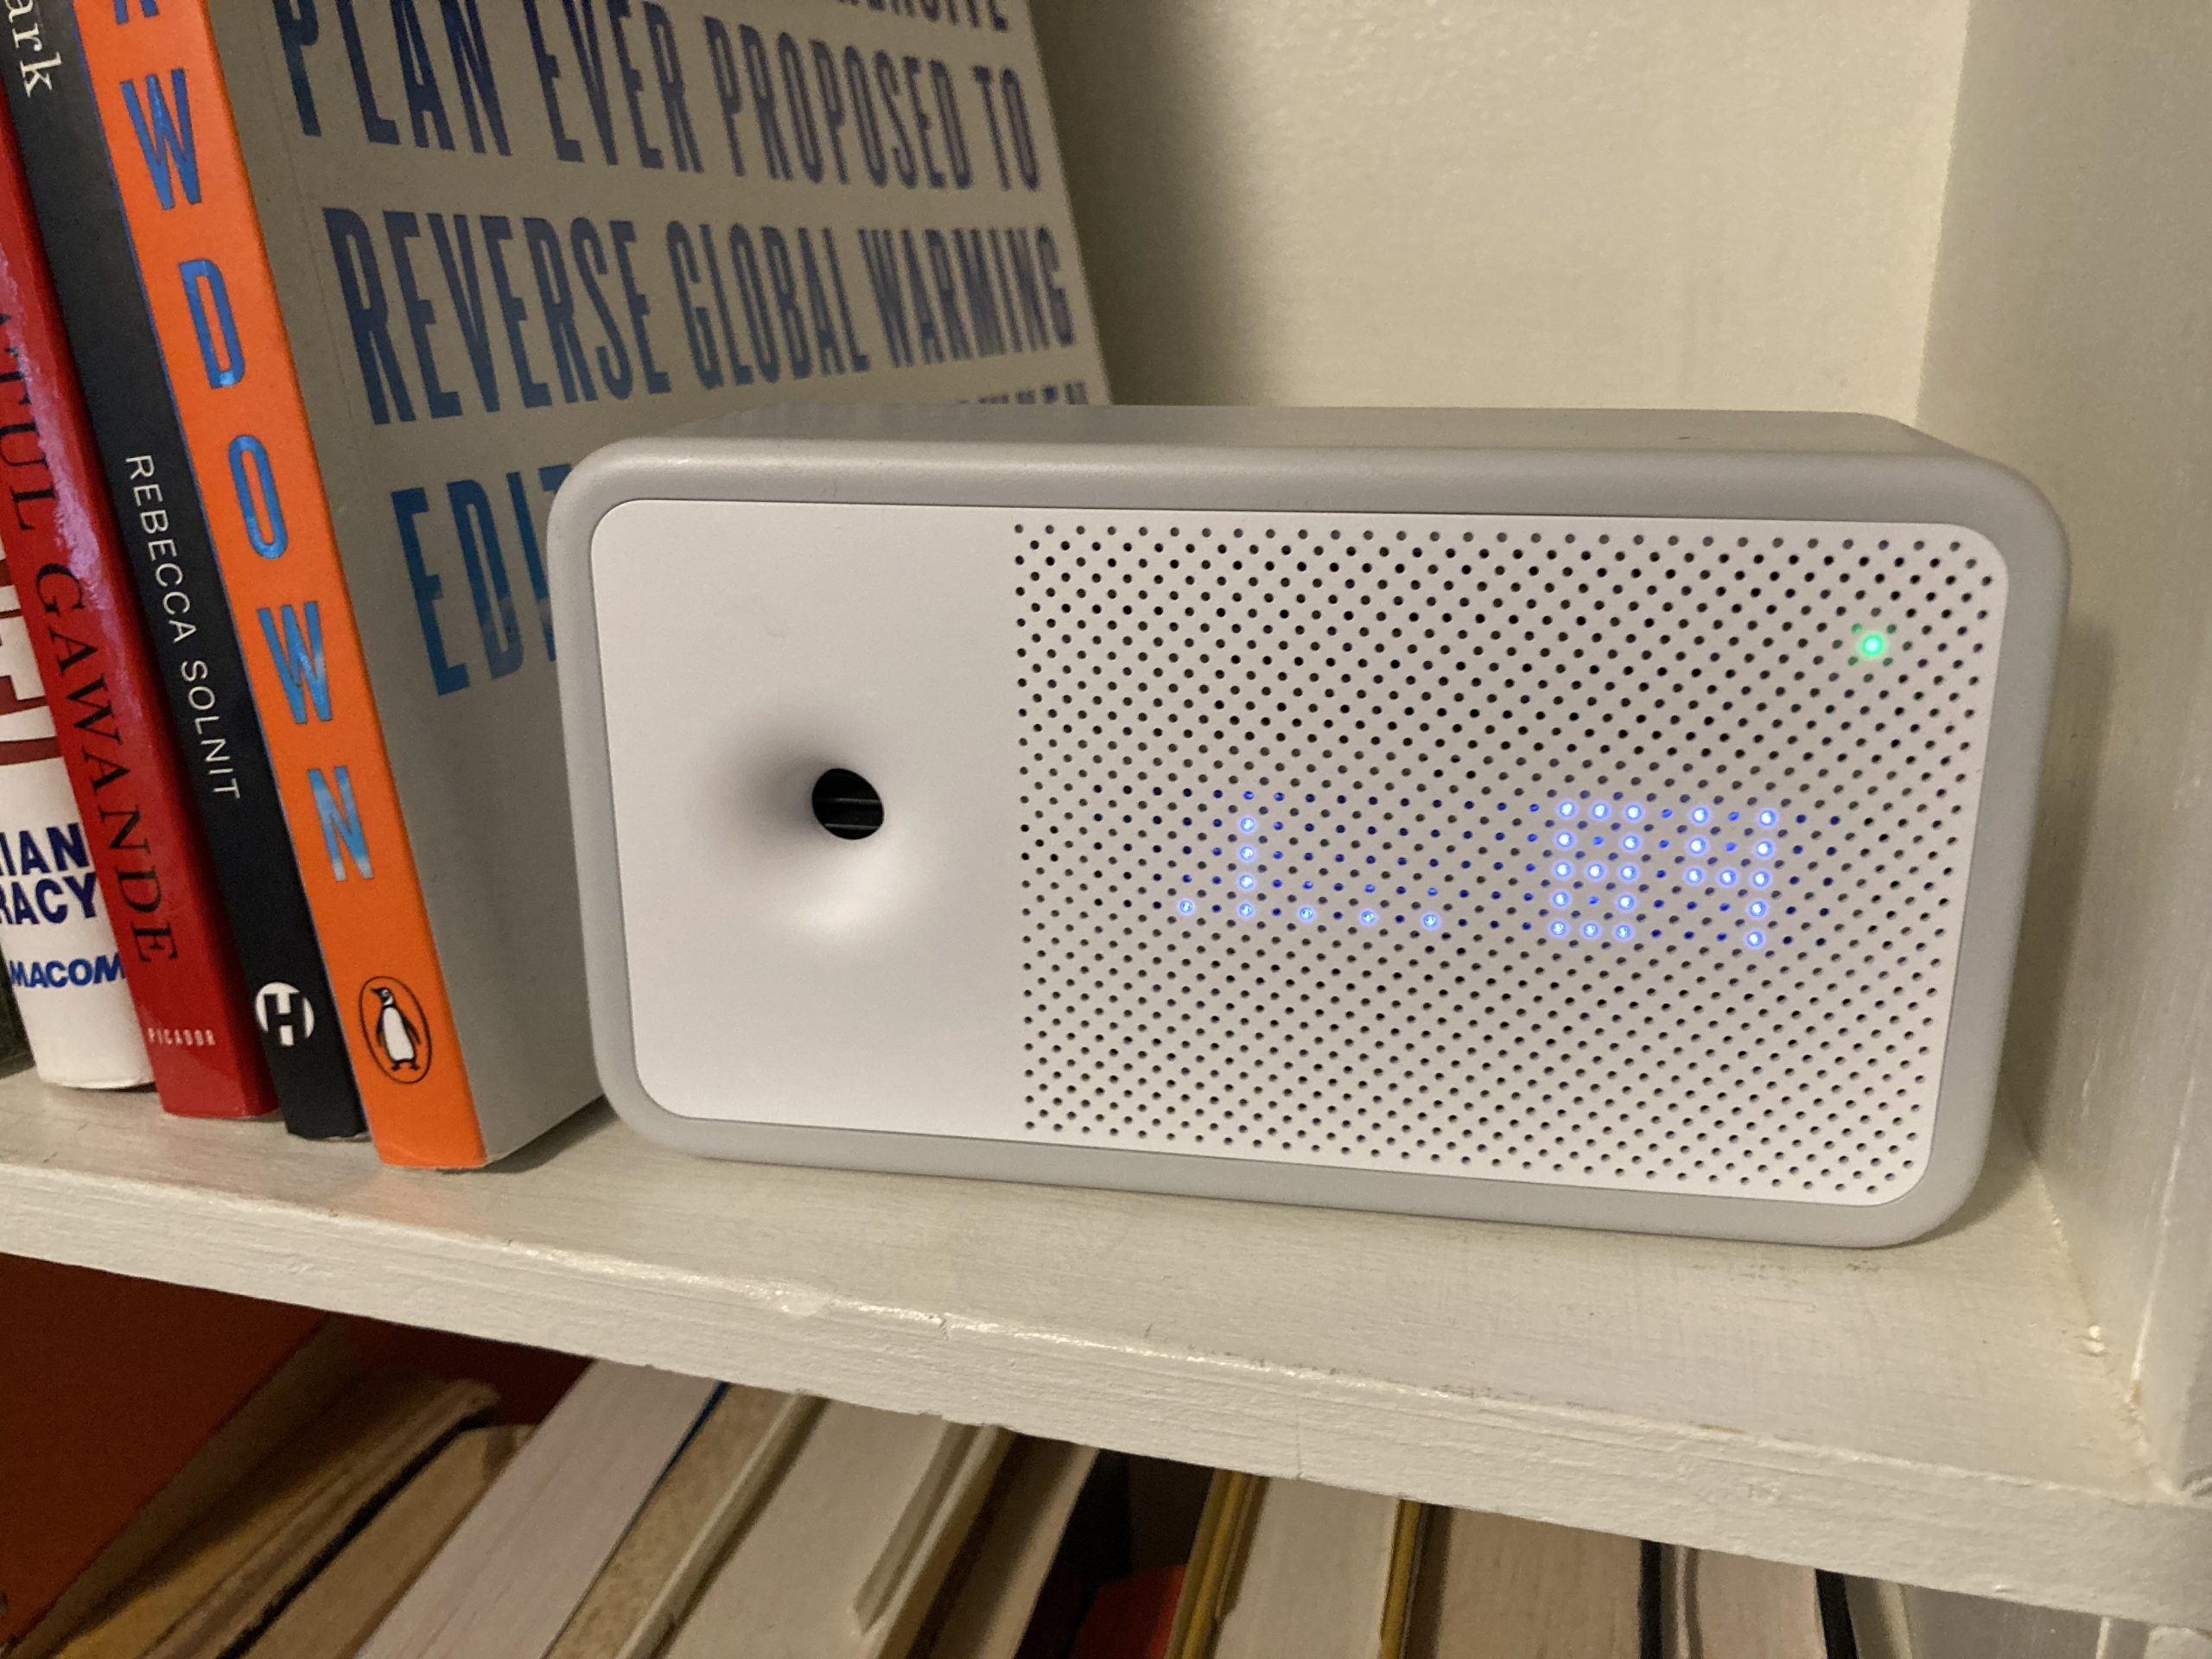
I’ve been monitoring the carbon dioxide levels in my home with two Awair Element indoor air quality (IAQ) monitors, one in the den and another in the master bedroom. The chart above shows the CO2 levels in my den for the last week. At the lowest point, our indoor CO2 level was the same as outdoors. This monitor doesn’t read lower than 400 ppm, and the outdoor level doesn’t go much below that these days. The highest CO2 level we experienced that week was 653 ppm. (The resolution of the Awair Element is ± 75 ppm or 10%, so don’t get too hung up on the exact number. And completely ignore the meaningless decimal.)
What’s a bad level of CO2 in the indoor air? ASHRAE, the US EPA, and other IAQ sources say 1000 ppm is the number you don’t want to exceed. Mainly, the CO2 level is used as a proxy for indoor air quality because it indicates how much air exchange you have between indoors and outdoors. Of course, particulate matter 2.5 microns or smaller (PM2.5) is an important indoor air pollutant that may get worse with more ventilation, so you can’t look at a low CO2 level and assume your IAQ is good. Likewise, you may have really low PM2.5 because of good filtration but high CO2 from poor ventilation.
Let’s focus just on CO2 and ventilation here. Most of your indoor CO2 above 400 ppm is from the people who occupy the space. The chart above shows when my wife and enter the den and spend time there because that’s when the CO2 level rises. When we leave the room, the CO2 level there drops. We never hit 1,000 ppm, which is great, but this is spring and we have some windows open. In winter and summer with the house closed up and no whole-house ventilation system running, CO2 levels go higher. Once I get my new Zehnder ERV installed, I expect to see the CO2 levels stay low even when the house is all closed up.
The rebreathed fraction of your indoor air
David Elfstrom, an engineer in Canada, has been posting a lot on LinkedIn and Twitter about rebreathed air. He even posted a screenshot from a spreadsheet (below) he put together that correlates the indoor CO2 level with the fraction of rebreathed air. Elfstrom used the equations in a paper from 2003 to make the connection.
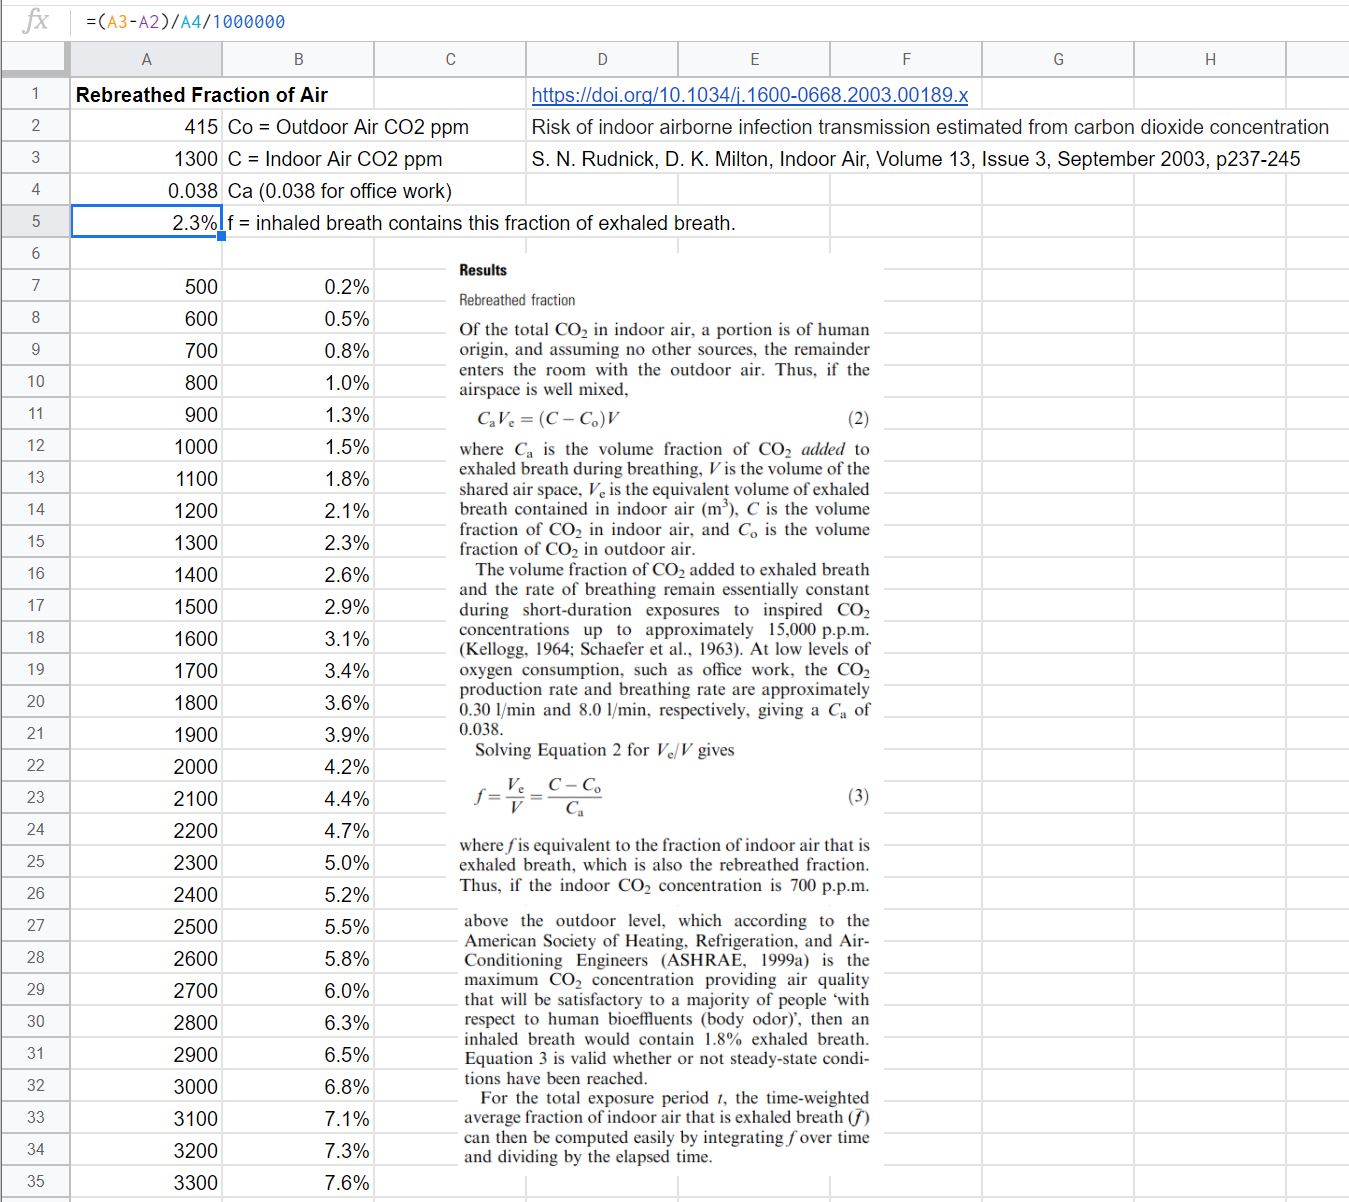
For low CO2 levels, the amount of rebreathed air you inhale is low. It’s only 0.2% at 500 ppm. By 800 ppm, the highest we’ve seen in our den, the percentage of rebreathed air is up to 1%. By the time you get to 1500 ppm, 3% of every breath you take is air that was recently exhaled from someone’s lungs.
Note that I didn’t say “someone else’s” lungs because some of that rebreathed air was yours. If you’re one of only two people in the room, about half of the rebreathed fraction would be from you. With four people in the room, now 75% of the rebreathed fraction is from other people. The general conclusion is that the more people are in a room and the higher the CO2 level, the more of other people’s air you’re rebreathing.
Since we know that COVID-19 is spread mainly through aerosols that can float around in the air for hours, the amount of rebreathed air can be a determining factor of your risk for contracting this ailment. If CO2 levels are high, make sure to wear a good mask—or double mask—if you’re around people from outside your household. Otherwise, you might as well exchange underclothing.
_________________________________________________________________________
Allison Bailes of Atlanta, Georgia, is a speaker, writer, building science consultant, and founder of Energy Vanguard. He is also the author of the Energy Vanguard Blog and is writing a book. You can follow him on Twitter at @EnergyVanguard.
Weekly Newsletter
Get building science and energy efficiency advice, plus special offers, in your inbox.


10 Comments
Do you see a day where you “zone “ an ERV like we do with Heating/cooling,? something like a sensor based ERV that open vents when a sensor indicates an unsafe CO2 level? Only ventilate when the CO2 exceeds a set point.
A very good question, I'm curious what Allison thinks also. I know some units can already be set to run based on measured CO2 or VOC levels, but as far as I've seen the only 'zoning' is with separate units, e.g. separate HRVs for apartments or through-wall unit synchronized pairs.
We set out to do that in my house with a VanEE 150ERV and a new EcoBee4 thermostat. While there are Applets for IFTTT for the Ecobee, and while we have ERV controlled by the EcoBee - there is currently NO IFTTT applet to take results from our Airthings (or other) CO2 monitor and to use as a trigger for the ERV. All we can do is when CO2 reaches a certain level, run the air handler recirc but not the ERV. Seems smart thermostats have not figured out air yet. Google NEST cannot even connect directly to an ERV/HRV. Until EcoBee develops the right applet - we will have to wait, as I'm not about to program a low-voltage IFTTT enabled switch to trigger the HRV separately... (already fried one ERV motherboard - I'm done fiddling with it!)
I think CO2 levels change too quickly for that to be effective. As you can see in Allison's example, two people go in to a room for a bit and the CO2 level rises rather quickly. Perhaps more importantly, CO2 is a proxy for other contaminants such as VOC's and pathogens that could be spread anywhere throughout the house.
Generally the highest CO2 levels in a home are in closed bedrooms at night. A good strategy, IMO, is to pull air to be exhausted from bathrooms and supply fresh air either to the return just before the air handler or directly to bedrooms. And I think perhaps the best is to the return during awake hours and to the bedrooms during sleep hours as supply to the bedrooms could also short-circuit directly to a local bathroom so not ventilate the entire home as well.
“Relative to 600 ppm (parts per million), at 1000 ppm CO2, moderate and statistically significant decrements occurred in six of nine scales of decision-making performance.”
https://pubmed.ncbi.nlm.nih.gov/23008272/
So I wouldn't design a quality house for 1000 ppm. So use >= 20 CFM fresh air supply per person in closed door rooms with there being a reasonable argument for 30 CFM/person in a closed door office.
It adds up pretty quickly, so automatic zoning is probably a good idea.
Yes. In the 1990's OSHA said 10,000 ppm CO2 was acceptable. :-)
We target a max of 700 ppm in our house though try to keep it lower, especially in our sauna.
More: https://bamasotan.us/2020/12/sauna-ventilation/
Well, we have a lot of books in common.
I read an article several years ago by Dave Elstrom. He was trying without success to control his HRV based on CO2. I use Netatmo Healthy Home Coach Monitors to measure CO2 plus humidity, temperature and noise level. Starting with 1 device, I quickly realized I had problems. When relatives come for holidays, the CO2 can exceed 1500 ppm. Close a bedroom door, and it rises to 1,100 by 4 AM.
I moved the device around my 3,600 sq ft house to diagnose the issues. To fix issues, I added a separate HRV for the lower level, changed the number of inputs and outputs, balanced the system and added 3 more devices to monitor the air on my phone. I set the thresholds for notifications to avoid over and under-reporting.
The air is better, but there are still times when I get a notification the CO2 is above 700-800.
And we open the windows more often.
This was a very helpful and timely article. I have a 1965 house that had a ACH50 of ~7.5 when we moved in and air quality wasn't a concern. Fast forward through a lot of insulation and air sealing improvements and our ACH50 is ~3.5 (final blower door test happening after the last 4 windows installed in a few weeks). I suspected we would need to add some mechanical ventilation to account for this improvement in air sealing but wasn't certain. The monitor I purchased after seeing this article has made it pretty clear we need some fresh air. This time of year we often have windows open, but within a few hours of closing them, CO2 rises to 1200-1600 depending on how many people are home (see picture attached). I suspect this will be even more of a concern as we close things up more consistently in the heat of the summer and winter. Leaning towards the Panasonic FV10VEC2 but still a bit more research to complete. Thanks for the article.
Be cautious with selecting a monitor. Some that don't have an actual NDIR sensor, such as Foobot, are totally unreliable. Others, such as uRad A3, do not accurately compensate for temp & pressure so can provide wildly inaccurate info. Awair v1 was quite poor for PMx and not great for CO2 though v2 is much better.
The best we've found are IQAir. CO2 is typically within about 5-10% (actually within about 2% if CO2 is constant as these tend to lag actual which accounts for the greater difference). RH on these can be off by about 11 points (11% RH) so if actual is 53% RH these might say anywhere from 42% to 64%.
Awair v2 appears second best and Netatmo behind that.
It'd be good for there to be some verifiable standards and testing of these devices as many such as Foobot and uRad are surprisingly inaccurate and misleading.
Log in or create an account to post a comment.
Sign up Log in