
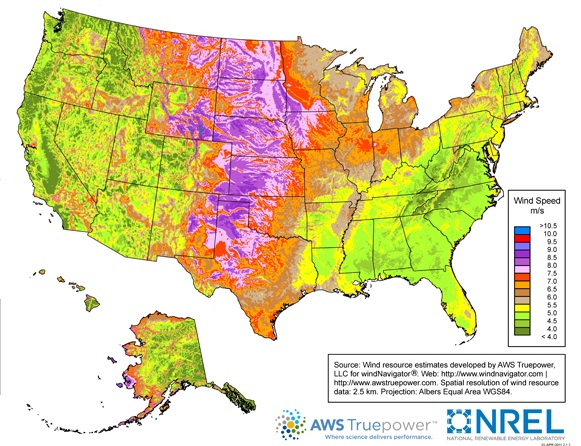
Image Credit: AWS Truepower for windNavigator, via National Renewable Energy Laboratory
More Green Building News


Back in 2007, the output capacity of utility-scale wind turbines in the U.S. was a little over 16,500 megawatts – a tiny fraction of what would be required to meet overall demand, but still enough to make the wind industry a viable, emerging player in electricity generation.
Since then, wind power’s stature as a renewable-energy alternative has continued to grow. By 2016, economies of scale in the manufacture of wind turbines and improvements in their output capacity will reduce the cost of wind-generated electricity by 12% – enough to make wind power competitive with electricity generated by gas-powered turbines, according to a report published this month by Bloomberg New Energy Finance, which specializes in analysis of the clean-energy industry.
According to Bloomberg New Energy Finance, “The best wind farms in the world already produce power as economically as coal, gas and nuclear generators; the average wind farm will be fully competitive by 2016.”
Manufacturing costs over the past 27 years have dropped about 7% for every doubling of installed turbine capacity. Global average turbine prices, the BNEF report notes, have shrunk from $27 million per megawatt of capacity in 1984 to $1.85 million in 2011. By the end of this year, there will be an estimated 240 gigawatts of installed capacity worldwide, up from 0.3 gigawatts in 1984.
Bigger, taller assemblies
The increase in output capacity is due to the fact that turbines have been getting bigger and more aerodynamic, and are mounted on taller towers and equipped with gearboxes and controls that combine to produce electricity more efficiently. Per-unit capacity has increased about 13 percentage points since 1984, to 34%, BNEF says.
According to government estimates, average wind load is heavy enough for power generation on only about 6% of the land area in the contiguous United States, so it remains to be seen how big a role wind will eventually play on the grid. But Justin Wu, lead wind analyst at BNEF, says that both wind and photovoltaic technologies are becoming cost-competitive at a rate that will soon make them major players in the energy market.
“In the next few years the mainstream world is going to wake up to wind cheaper than gas, and rooftop solar power cheaper than daytime electricity,” Wu said in a BNEF summary of the study. “Add in the same sort of deep, long-term price drops for power storage, demand management, LED lighting, and so on – and we are clearly talking about a whole new game.”
Weekly Newsletter
Get building science and energy efficiency advice, plus special offers, in your inbox.


6 Comments
output capacity vs. actual output
Hi Richard,
I am a big fan of wind energy and the price declines are good news for a good industry. I was fortunate to get a side job in college of erecting testing towers throughout Iowa to collect data for the wind map of the state. The utilities and investors were building wind farms off this data in the late 1990's and I've seen many more wind farms around the state here since then.
From the data I've read a couple years ago, we have an output capacity of about 15% of wind power in the state now, which is impressive. Coal is 60-something% of output capacity, we have some nuclear, hydro, biomass, etc. to round out the 100% of generation capacity.
What is never mentioned is actual output. I would be very interested in what the wind farms are actually outputting now that they are in operation. I expect it's less than their optimal rated capacity, but how much less? Does anyone know this kind of data? It would be good to have a reality check on this.
Thanks,
John
Response to John Rousseau
John,
Your questions concern the capacity factor of wind developments. Here's some information to answer your questions:
http://en.wikipedia.org/wiki/Wind_power
"Since wind speed is not constant, a wind farm's annual energy production is never as much as the sum of the generator nameplate ratings multiplied by the total hours in a year. The ratio of actual productivity in a year to this theoretical maximum is called the capacity factor. Typical capacity factors are 20–40%, with values at the upper end of the range in particularly favourable sites. For example, a 1 MW turbine with a capacity factor of 35% will not produce 8,760 MW·h in a year (1 × 24 × 365), but only 1 × 0.35 × 24 × 365 = 3,066 MW·h, averaging to 0.35 MW."
http://en.wikipedia.org/wiki/Capacity_factor
"As of April 2011, the Danish wind farm Horns Rev 2 (the world's largest when it was inaugurated in September 2009 comprising 91 Siemens SWT-2.3-93 wind turbines each of 2.3 MW) with a nominal total capacity of 209 MW, has the best capacity factor of any offshore wind farm at 46.7% having produced over 1.5 years 1,278 GW·h. The record for an onshore wind farm is held by Burradale, which reached an annual capacity factor of 57.9% for 2005."
DIY Wind Energy Projects
First I'd like to say I was impressed by the comment response to John Rousseau given by Martin Holladay, GBA Advisor.. the pertinent details were well stated.. Next.. I get excited thinking that Wind Turbines, especially Verticals are soon to be DIY affordable for every home owner, farm, ranch, and for the small business owners Rapidly the Technology is spreading to those smaller affordable units. Amen. http://energyreviewsinfo.com
Response to John Rousseau
The Midwest ISO publishes realtime/hourly output for wind in the region they serve, see http://bit.ly/uHRfcC . I've been collecting the data for 2 months and it's averaging about 4000MW of output. Based on information from MISO the installed nameplate capacity seems to be about 10,000MW. Attached is a graph of the aggregate data from those 2 months, based on data from that link above.
So, about a 40% capacity factor based on those 2 months anyway.
(FWIW, I'd love to see similar reputable data for any vertical-axis residential turbine. Data from the city of Reno is not encouraging at all - http://bit.ly/i7ZDn4 )
Vertical Axis Wind Turbine studies
In all the field tests I'm aware of, VAWTs have performed badly. Check out Paul Gipe's web page for reasons why:
http://wind-works.org/articles/small_turbines.html#Vertical%20Axis%20Wind%20Turbines
Field testing has been done on VAWTs by NREL http://www.nrel.gov/wind/smallwind/independent_testing.html
If you hunt a little, you can find field tests from the UK, atop the the Boston Museum of Science, and elsewhere - none of the VAWTs performed well.
wow that city of reno data
wow that city of reno data shows some awful results
they may not even generate enough to cover inverter losses if the monitoring tools included consumption data during no generation points
a real slick site for showing the info too
Log in or create an account to post a comment.
Sign up Log in