

More Guest Blogs


This is the second of a four-part series that takes a deep dive into the economics of our electric system and the role pricing can play in accelerating the clean energy economy. The first article in the series was Transforming the Electric System.
The price we all pay for electricity generally does not reflect the “true costs” of producing it. As described in a recent blog post, generating electricity creates harmful pollution, damaging the environment and public health. This comes with a cost, but it is not necessarily paid for by those generating the pollution or purchasing the electricity. These types of costs are known as “external costs.”
For example, a coal-fired power plant releases pollution into the atmosphere, which adversely affects the health of residents in nearby communities. This pollution is an example of an external cost because it causes health problems that neither the plant owners nor the electric users pay for (unless they live near the plant and pay the cost through their health bills).
From coal mining and energy production, to distributing and using that energy, to disposing of waste products, electricity has many external costs. By examining them, we can better understand the true cost of electricity and how it varies depending on the technology or fuel used to generate it.
Upstream operations
Upstream operations take place before electricity is generated. For fossil-fuel and nuclear generators, the largest upstream external costs are associated with producing, processing, and transporting fuel. For solar and wind, the main upstream impacts are associated with manufacturing and transporting materials required for the solar panels and wind turbines.
The external costs associated with upstream operations can be significant. Natural gas, for example, burns cleaner than other fossil fuels such as coal. However, methane, the primary component of natural gas, is a very potent greenhouse gas – up to 84 times more powerful than carbon dioxide in the first 20 years it is released into the atmosphere. Leaks and intentional releases of this damaging pollutant during the production, delivery, and use of natural gas, if not addressed, have the potential to negate the environmental benefits of natural gas over coal.
The potential dangers of methane from natural gas operations can be most starkly seen in the recent, massive methane leak at a natural gas storage facility in Aliso Canyon, California. After a well in the facility failed, it leaked a total of 97,000 metric tons of methane before the gas company was able to plug the leak. This is the short term climate equivalent of burning almost a billion gallons of gasoline.
Downstream operations
Downstream operations take place during the generation of electricity and its subsequent transmission and distribution to customers. Downstream operations potentially affect health, climate, and water.
Pollution from fossil-fuel power plants makes up a significant portion of the downstream external costs associated with electricity generation. The U.S. Clean Air Act regulates and limits the amount of common pollutants power plants can release, including particulate matter (PM), sulfur dioxide (SO2), and oxides of nitrogen (NOx). Emissions of SO2 and NOx also are regulated under various cap-and-trade programs. While these programs have substantially reduced SO2 and NOx pollution, the remaining emissions from fossil-fuel generators still have adverse health impacts, including premature death and asthma.
A National Research Council study in 2005, for example, found these health-impacting pollutants from coal- and gas-fired power plants, respectively, cost society 3.2 cents and 0.16 cents per unit of generated electricity (kilowatt-hour). With an average household in the United States using about 11,000 kilowatt-hours of electricity each year, the health cost associated with that electricity consumption would be about $350 per year if it all came from a coal plant.
Climate impacts
In addition to the types of pollution described above, fossil-fuel power plants also release greenhouse gases like carbon dioxide into the atmosphere – the main culprit of climate change. The carbon intensity of electricity generation varies significantly by fuel and technology, with coal and oil generation producing the most carbon and certain renewable energy, like solar and wind, producing none. However, as mentioned earlier, these renewables do produce carbon in upstream operations. The graph (above) shows the total lifecycle carbon emissions for each technology, including upstream and downstream emissions.
A coal-fired plant emits about one ton of carbon for each 1,000 kilowatt-hours of electricity it generates over its lifecycle. In 2013, the U.S. government updated its estimate of the cost to society of each ton of carbon emitted (also known as the “social cost of carbon”) and valued it at approximately $40 per ton. Based on that estimate, the climate-related damages from coal plants equal 4 cents per kilowatt-hour on average. However, $40 per ton is an underestimate because not all climate damages are considered in this figure.
Overall, the electric power sector contributes significantly to the nation’s carbon emissions – equaling almost 40% of total U.S. emissions in 2015. Based on the social cost of carbon, climate-related damages from the power sector were nearly $80 billion in a single year. That cost is mostly borne by current and future generations through increased frequency of extreme weather events like flooding, drought, storms, and so on.
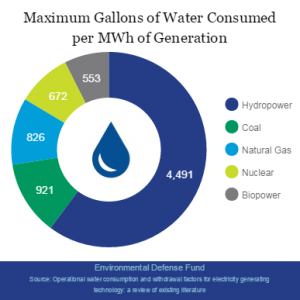
Water Impacts
Certain power plants need large amounts of water to operate, reducing water quality and intensifying drought in some areas. These plants occasionally release chemical pollutants into nearby lakes or rivers. Even when these instances are limited and regulated, there are still occasional, accidental releases like the 2014 Dan River coal ash spill in North Carolina. Importantly, solar and wind require no water to produce electricity, making them a less costly choice in terms of water impacts.
So what should we do with these external costs now that we know more about them? Incorporating the health and environmental costs of electricity into the price we pay for it is one solution for which Environmental Defense Fund is advocating. Doing so will help reduce pollution and ensure a level playing field for clean energy in our electricity markets, creating a cleaner system for everyone.
Ferit Ucar is a senior clean energy economist with the Environmental Defense Fund. This post originally was published on April 28.
Weekly Newsletter
Get building science and energy efficiency advice, plus special offers, in your inbox.


5 Comments
The IPCC bar graph needs better explanation
For natural gas to have the same carbon footprint equivalent relative to coal in that bar graph it would have to either be operating at about the same thermal efficiency as coal plants or there is a presumed and fairly substantial methane release per kwh. The average sub-critical coal plant runs in the low 30s percent efficiency, supercritical coal in the 40s. Combined cycle gas plants (dominant, in the US grid) operate in the 50s bumping on 60% thermal efficiency when load & operating conditions are optimal. The carbon-equivalent footprint of gas plants in the US is probably between half an 2/3 that indicated unless high methane release during the fuel extraction is presumed.
That does little to blunt the argument that simply changing coal & oil fired generation over to natural gas simply isn't going to be enough to meet greenhouse gas targets, however.
The water-use footprint of fossil burners and current technology nuclear is also a big problem that needs to be addressed, since power output sometimes needs to be curtailed on these sources during heat waves or drought, a serious constraint during air-conditioning peak loads. PV solar also loses efficiency at higher temps, but it's nowhere near the hit taken when throttling down a nuke.
reply to Dana
The release of natural gas in large quantities (like the massive Aliso Canyon leak) could be part of the calculation, especially considering methane has 100x the GWP than CO2.
@Jason. Methane is ~21-38 times vs. CO2.
https://www3.epa.gov/climatechange/ghgemissions/gwps.html
https://en.wikipedia.org/wiki/Global_warming_potential
@Chris M.
According to your links, methane has a GWP of 86 over 20 years and 28-36 over 100 years. So my point still stands: methane has 28-86 times the GWP of CO2.
Of course the methane counts...
...which is prompted the speculation "...unless high methane release during the fuel extraction is presumed."
The bar graph alone without the underlying assumptions can be misleading. Lot's of things "...could be part of the calculation...", but I'd personally like at least a somewhat fuller description of how those relative numbers were developed, without having to dig into the footnotes of the IPCC Special Report on Renewable Energy Sources and Climate Change Mitigation. It's a tidy little graphic, with potentially big error bars on the numbers.
Log in or create an account to post a comment.
Sign up Log in