
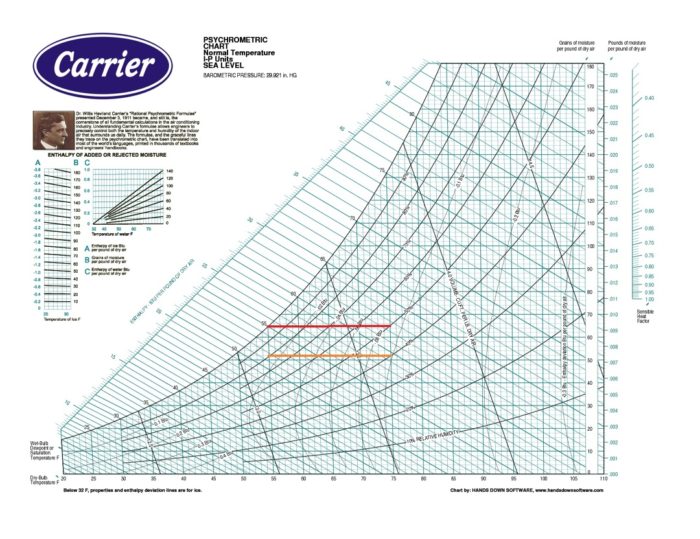
Image Credit: Carrier Corporation
More Building Science


Psychrometrics, you may recall, is the science that involves the properties of moist air and the processes in which the temperature or the water vapor content or both are changed. To understand how all that works, we need quantities and we need them to be well defined. Some are easy to understand (e.g., dry bulb temperature and barometric pressure); others are a bit more abstract (e.g., enthalpy). Here we’ll take a look at the main psychrometric quanitites, define them carefully, and tell which commonly used term you should avoid.
The properties of moist air can be described by dozens of quantities. Don Gatley, in his book Understanding Psychrometrics, says there are more than 50, with one piece of psychrometric chart software allowing you to plot as many as 63. We’ll confine ourselves to the top nine in this article, but I’ll also tell you about a couple of terms it’s best to avoid even though they’re commonly used.
In defining the nine psychrometric quantities below, I’ll give you the basic info about what they are, what might make them confusing, and which ones can be measured. The majority of the dozens of psychrometric quantities we could work with cannot be measured directly but rather must be calculated from other, measurable quantities.
Another important thing to understand is that to determine a state point on the psychrometric chart, we need to know the values of three independent quantities:
- Barometric pressure (or altitude, from which we can get the barometric pressure).
- Dry bulb temperature
- A quantity that tells us how much water vapor is in the air. It could be wet bulb temperature, dew point temperature, relative humidity, or any of a number of other quantities.
The top nine quantities
Here’s Gatley’s list of the top nine psychrometric quantities, sorted by whether we can get them by measurement or have to calculate them.
| Quantity | Symbol | Measurable? |
| Dry bulb temperature | TDB | Yes |
| Wet bulb temperature | TWB | Yes |
| Dew point temperature | TDP | Yes |
| Barometric pressure | pbar | Yes |
| Water vapor pressure | pWV | No |
| Relative humidity | RH | Yes |
| Specific enthalpy | h | No |
| Specific volume | v | No |
| Humidity ratio | W | No |
Now, let’s take a look at each one individually. I’ll give you what I think is the essential knowledge you need about them. To go deeper, read Don Gatley’s book. He’s got a separate chapter on each quantity.
Dry bulb temperature
This one’s easy. It’s the temperature we’re talking about when we use that word without any descriptors in front. It’s how hot or cold the air is. It can be measured in a number of ways and is one of the three independent quantities we need to define a psychrometric state point.
One definition of temperature is that it’s a measure of the kinetic energy of the molecules. It’s not the best definition (because of things like quantum mechanics and zero point energy), but it’s fine for this discussion. And that brings us back to air, and the molecules it comprises. Recall that air — moist air — is made of dry air and water vapor. When we measure temperature of the air, it includes both components, so the dry bulb temperature of the air applies to both. They’re equal.
On the psych chart: Dry bulb temperature is shown on the horizontal axis along the bottom.
Wet bulb temperature
Actually, that should be plural since there are two types of wet bulb temperature: what we measure with a psychrometer and the thermodynamic wet bulb temperature. Fortunately, if you use the psychrometer properly, the two numbers are very close. It’s sometimes called the temperature of evaporation because you measure it by wrapping a wet material around the bulb of a thermometer, swinging the thermometer in the air at a certain rate, and then recording the temperature reading. It’s lower than the dry bulb temperature because swinging the wet bulb thermometer causes some of the water to evaporate, taking some heat away.
Well, I say it’s lower, but it’s not always. There’s one condition where the wet bulb and dry bulb temperatures are equal. Know what it is? Saturation. When the space (not the air) can’t hold any more water vapor molecules without some of them condensing into liquid water, the wet bulb temperature equals the dry bulb temperature.
On the psych chart: Wet bulb temperature lines run diagonally downward from the saturation curve toward the right.
Dew point temperature
This one’s similar to wet bulb temperature but in the opposite direction. Wet bulb is the temperature of evaporation. Dew point is the temperature of condensation. If you take a volume of air and cool it down with adding or removing water vapor, you eventually reach a temperature where condensation occurs. You’ve reached the dew point, or saturation.
Here’s one of my favorite questions to ask students about dew point: If you have a volume of air and don’t change the water vapor concentration, what happens to the dew point when you increase (or decrease) the dry bulb temperature? Do you know? (The answer is below.)
And here’s another one for you: When are the wet bulb and dew point temperatures equal? As with wet bulb and dry bulb, they’re equal only at saturation. And that means all three are equal at that point. As soon as you get away from saturation, however, the three temperatures diverge.
On the psych chart: Dew point temperatures are horizontal lines. The value is usually shown at the saturation curve.
Barometric pressure
This one’s pretty easy. It’s just atmospheric pressure. It’s helpful to think about it as a bunch of collisions. If you put those air molecules in a container, they’ll hit the walls of that container and push outward on them. The force per unit area they exert on the walls is the pressure of the air.
Here on earth, barometric pressure results from the weight of all the air above the volume we’re studying. Since there’s more air above Savannah than above Salt Lake City, the barometric pressure is higher in the former city. In fact, altitude is an equivalent quantity because if we know it, we can easily determine the barometric pressure. Yes, it does vary with weather, but those variations are small compared to the changes with altitude.
Then there are the two components. Remember our mixture: Air is a combination of dry air and water vapor, so some of that barometric pressure comes from the dry air component, some from the water vapor. Together, they add up to equal the barometric pressure.
pbar = pDA + pWV
This is an important relation used to do a lot of psychrometric calculations.
On the psych chart: Barometric pressure isn’t actually shown as a variable on the chart. It’s used to calculate a particular chart. If you’re more than a thousand feet from sea level, you’ll need to make sure you use the correct chart because it affects the values of some of the psychrometric quantities.
Water vapor pressure
Well, we just saw that this quantity is one part of the total, or barometric, pressure. It’s an important quantity, too. It determines which way water vapor moves: from higher vapor pressure to lower vapor pressure. It’s also used in determining a couple of important quantities I’ll discuss below.
I know what you’re thinking. You’re thinking, this would be a great time to discuss a pot of water with a closed lid over the top. And you’re right, because that’ll give us a another way to understand this thing called saturation.
So that pot of water is sitting there. If you leave it long enough and don’t change anything, the air above the water will become saturated. It will reach its maximum vapor pressure… at that temperature. If you lower the temperature, some of the water vapor will condense out. If you raise the temperature, more water vapor will evaporate into the space above the liquid. As it turns out, the saturation vapor pressure depends only on the temperature.
On the psych chart: Lines of constant vapor pressure would run horizontally if it were shown.
Relative humidity
Ah, relative humidity. It’s measurable. It’s talked about all the time. It’s not as easy to understand as you may think. One incorrect way of thinking about it, perpetuated by many well-meaning weather reporters, is that it’s the percentage of water vapor in the air compared to how much the air can hold.
There’s more than one thing wrong with that statement. First, the air doesn’t determine how much water vapor can be in a space. Second, it’s not the ratio of the mass or concentration of water vapor.
The actual definition is this:
RH = 100 x pWV / pWVS
Both vapor pressures in the equation occur at the same dry bulb temperature. That means you go straight upward from your state point to the saturation curve to find the two pressures. (Most psych charts don’t show vapor pressures, though.)
On the psych chart: Relative humidity shows up as curves through the chart. As the dry bulb temperature increases, the RH curves sweep upward from the bottom left. The 100% RH curve is the same as the saturation curve.
Specific enthalpy
Enthalpy was the bane of my undergrad thermodynamics studies. That was probably because I had to look it up in steam tables rather than learn the psychrometric chart, but let’s say a little bit about this mysterious quantity in the hope that it won’t be your bane.
First, there’s no tidy way to explain the concept of enthalpy. It’s sometimes said to be a combination of the sensible and latent heat content of a volume of air, and that’s part of it. But there’s another part that comes into play sometimes, and that’s the work done on the air. Here’s the equation that defines specific enthalpy:
h = u + pv
The equation says that specific enthalpy equals internal energy plus the product of the pressure and the specific volume (defined below). We can’t calculate absolute specific enthalpies, so keep in mind that only differences in specific enthalpy matter.
That idea that enthalpy is a combination of sensible and latent heat is from the first term in the equation. Changes in temperature or in the amount of water vapor result in changes in internal energy. If the pressure or volume also change, work is being done on or by the system, and that’s part of the enthalpy changes, too.
What can you do with enthalpy? When you’re putting a volume of air through certain psychrometric processes, as you do in air conditioning or dehumidifying air, you can find out how much heat will be added or removed from the air.
On the psych chart: Enthalpy lines run diagonally across the chart the same way the wet bulb lines do. They’re nearly parallel, and usually only one or the other is shown.
Specific volume
This is an easy one. It’s just the reciprocal of density. Instead of mass per unit volume, it’s volume per unit mass. But the mass used in psychrometrics is that of the dry air component.
On the psych chart: Lines of constant specific volume run diagonally across the chart in the same direction as wet bulb temperature and enthalpy lines, but at a steeper slope.
Humidity ratio
This is what’s usually shown on the vertical axis on the right side of the chart. It’s the ratio of the mass of water vapor to the mass of dry air, as shown in the equation below.
W = mWV / mDA
It’s sometimes called mixing ratio and a few other names, but in North America, humidity ratio is the name most often used. With a little bit of math involving the ideal gas equation and the equation for barometric pressure given above, it’s not hard to derive an equation for humidity ratio based on the barometric and water vapor pressures:
W = 0.62198 x pWV / (pbar – pWV)
It is left to the reader to derive the form based on relative humidity. (Go on! It’ll be fun!)
Now, let’s talk units. (We have this little weight/mass problem in those annoying imperial units, so think mass, not weight, when you see pounds here.) Humidity ratio can be given as pounds of water vapor per pound of dry air. In that case the humidity ratio scale would run from 0.000 to about 0.025.
To make the units a bit friendlier, we can use this strange thing called a “grain” of water vapor. Turns out it takes 7,000 grains to make a pound, which makes the scale go from 0 to about 180.
On the psych chart: Humidity ratio lines run horizontally across the chart, as do dew point temperature and vapor pressure. To avoid confusion, only one set of those lines is shown.
A term to avoid
Gatley defines some basic terms at the beginning of the book and also includes four terms he classifies as “discouraged.” The one I hear the most is absolute humidity. I have to confess I’ve been guilty of spreading this term myself, but I’ve recently reformed my ways.
Using the term “absolute humidity” isn’t as bad as saying “comprised of” or using the word “data” with a singular verb, but it’s ambiguous. If you look for definitions of it, you’ll find some that say it’s the same as humidity ratio. There are well known charts out there that do this, putting units of humidity ratio on the axis along with the term “absolute humidity.” According to Gatley, this is the standard definition in the field of physical chemistry. Much of the world, however, defines absolute humidity as the mass of water vapor per volume, which is not what’s plotted on the standard psych chart.
It’s best to avoid ambiguity and use humidity ratio instead of absolute humidity.
Putting them all together
If you’re still reading this article, you’re on the road to qualifying for Don Gatley’s Psychrometric Fools Society. You’re also on the road to understanding how all these things come together in that beautiful graph we call the psychrometric chart. Next time we’ll dive into that.
Answer to dew point question: Changing the temperature only has no effect on dew point.
Allison Bailes of Decatur, Georgia, is a speaker, writer, energy consultant, RESNET-certified trainer, and the author of the Energy Vanguard Blog. Check out his in-depth course, Mastering Building Science at Heatspring Learning Institute, and follow him on Twitter at @EnergyVanguard.
Weekly Newsletter
Get building science and energy efficiency advice, plus special offers, in your inbox.


2 Comments
It's over the top
The fact that the graph is usually cut off at the top makes me think that hot air can carry a near limitless amount of humidity. How asymptotic is that saturation curve anyhow?
Steam
Greg, yes, equilibrium the vapor pressure of water keeps going up as you go to higher temperatures. At 212 F, 100% humidity at atmospheric pressure corresponds to the "air" being purely water vapor, i.e. steam. Beyond that point, the appropriate charts are called "steam tables" rather than psychrometric charts.
This water vapor pressure chart might help give you an idea of how the transition between those regimes works:
https://www.chem.purdue.edu/gchelp/liquids/vpvst.gif
You might also want to read the Allison's blog where he explains why saying that air carries moisture can lead to unclear thinking about what's really going on. He provided a link to it when he said:
"When the space (not the air) can't hold any more water vapor molecules without some of them condensing into liquid water, the wet bulb temperature equals the dry bulb temperature."
The link is
http://www.energyvanguard.com/blog-building-science-HERS-BPI/bid/76437/Are-You-Making-This-Mistake-with-Humidity
Log in or create an account to post a comment.
Sign up Log in