

More Building Science


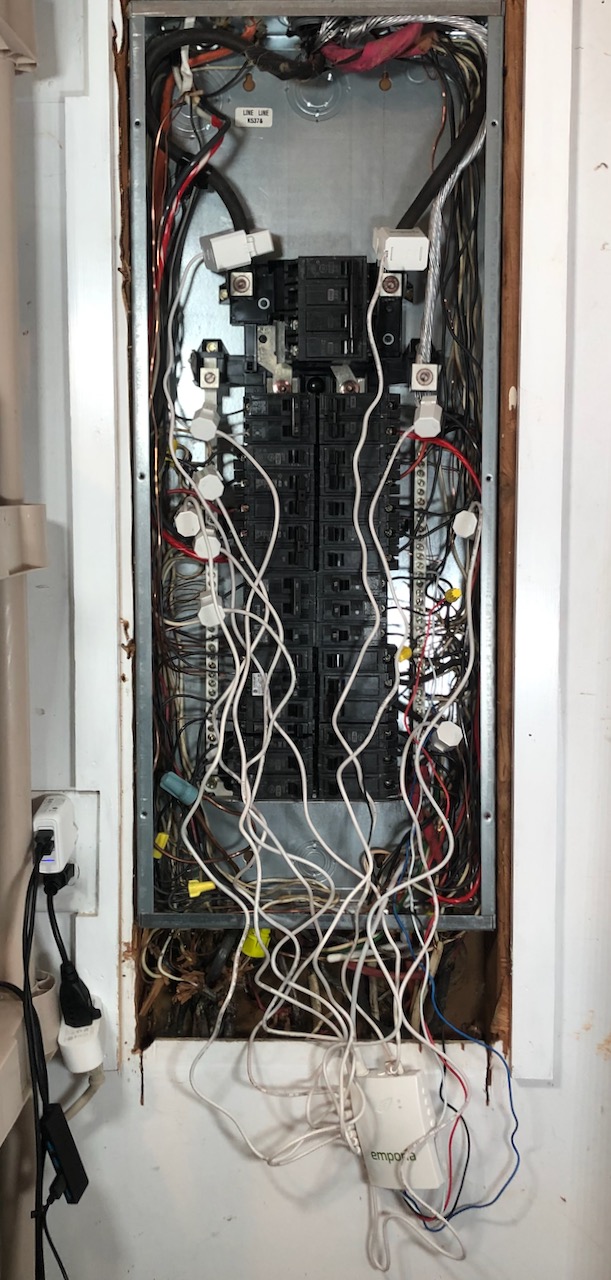
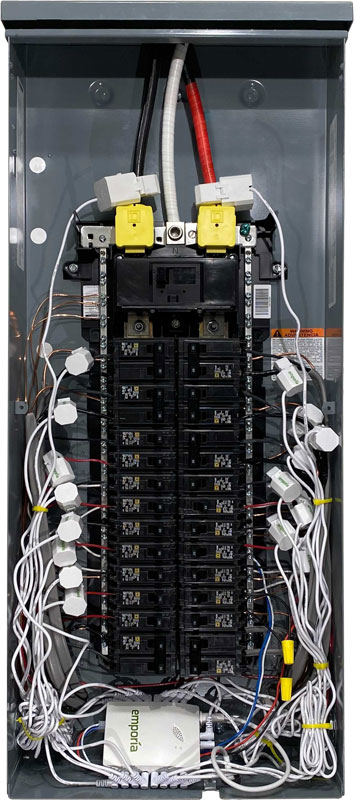
Last year, I bought the Emporia Vue whole-house electricity monitoring system. This past weekend, I finally installed it. The photo below shows my electrical panel with the monitor installed. Yes, it looks like a mess at the moment. The panel itself is a mess from all the changes made over the 61 years my house has existed. And I haven’t tucked all the Vue wires into the panel yet. I’m leaving it open for a bit while I tweak the setup but will close it up soon.
Whole-house electricity monitoring
Since the dawn of electric utility companies, we’ve had whole-house electricity monitoring. It provided only one number, though: the electricity used in the house each month. That’s what the traditional electric meter did. Many homes now have smart meters, which can provide a bit more information. The graph below shows my electricity use (and temperature) from the smart meter Georgia Power put on my house (shown in lead photo above).
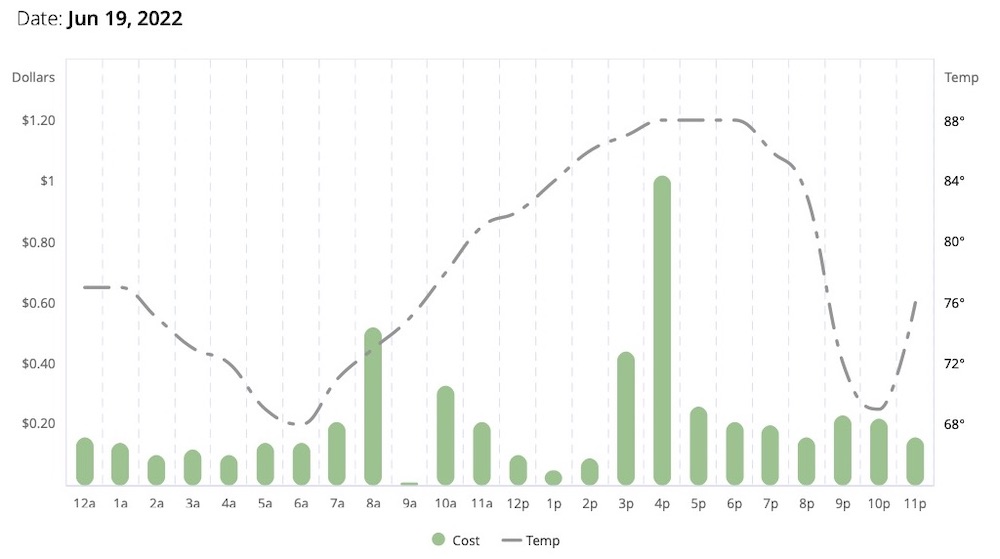
The finest resolution they show me is hourly, but they also should have the data by minute and by second in their system. With a shorter time scale, they can do disaggregation to identify individual loads in the house. A refrigerator, a heat pump, and a cable box, for example, all have different signatures in the electrical signal. That makes it possible to get a decent idea of how much electricity you’re using for the different appliances in your house.
Some secondary market whole-house electricity monitors also can do disaggregation. The big name in this category is the Sense energy monitor. It installs inside the electrical panel like the Emporia Vue but measures only the electricity going through the main wires bringing power into the panel.
The Emporia Vue uses the power going through the mains as one measurement. But it doesn’t rely on sophisticated algorithms to disaggregate the total power usage moment by moment. It actually measures the power in the branch circuits. The screenshot below shows the home screen for my setup.
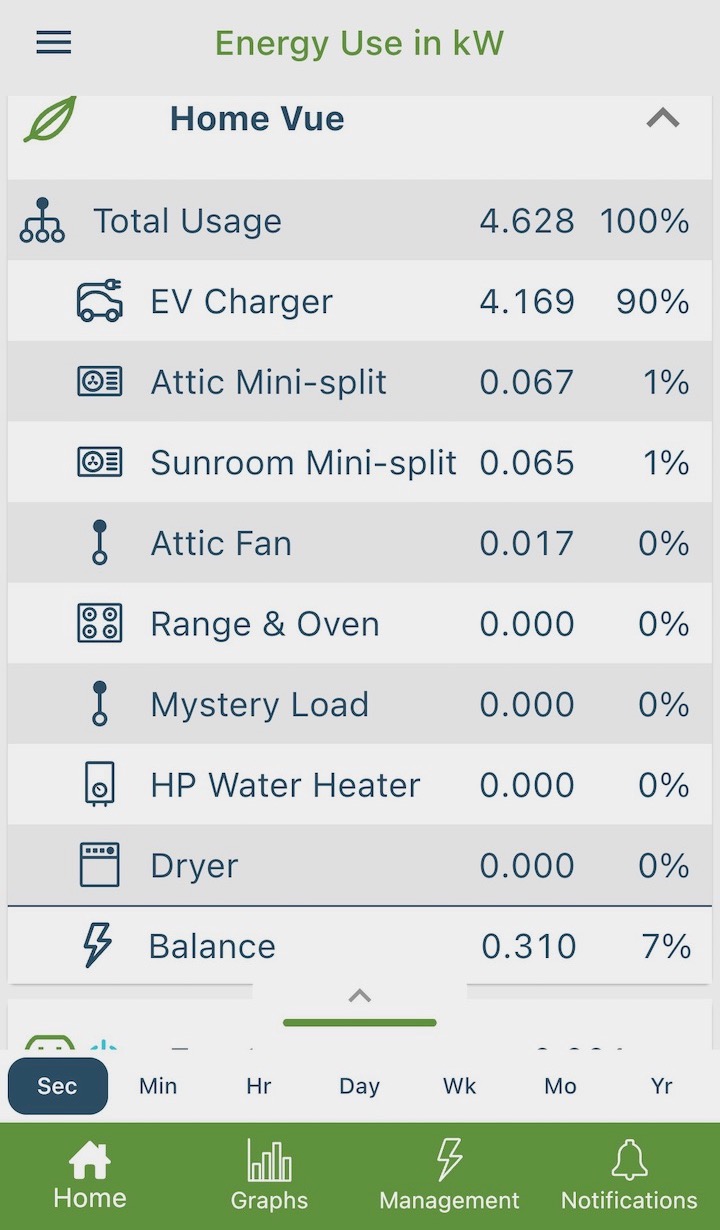
At the top, it shows the total power use. You can see at the bottom that I had the time scale set to seconds. At that instant, my whole house was using 4.628 kilowatts (kW) of electricity. The next eight lines show the branch circuits I set up to monitor. The line below them says “Balance,” which is the difference between the total use and the sum of my eight monitored circuits. At that time I was using 4.318 kW (93% of the total) in the monitored circuits and the rest of the house was using only 0.31 kW (7% of the total).
When you switch to a time scale of hourly or longer, the unit changes. Instead of measuring power in kilowatts, it shows you energy in kilowatt-hours (kWh).
Installing the Emporia Vue
First, the warning: Emporia recommends having a licensed electrician install the Vue in your panel. If you have any doubts or fears about doing it yourself, follow their advice. I installed the monitor myself, but you assume all the risks if you decide to go that route. I’m just providing information here.
Emporia’s instructions are clear and straightforward. They tell you exactly what you need to do and how to do it. I was able to install mine in less than an hour. Emporia says to turn off the power in the panel by flipping the main breaker before you start. That doesn’t mean you can’t get hurt or killed, though. The mains coming into the panel will still be live. If you have a disconnect outside the panel and turn it off, nothing inside the panel should be hot. It’s a good idea to test, though, with a voltmeter or voltage tester.
Looking at the photo of my panel above, you may be a little intimidated by the confusion of wiring. It’s actually simpler than it looks, though. There really are only four things to do, and they all center around the energy monitor box. It’s the little rectangular box hanging below my panel with a bunch of wires connected to it.
To that box, you connect these four things:
- WiFi antenna
- Wiring harness, which powers the device and senses voltage
- 2 large current transformers (CTs) that go on the mains
- 0 to 16 smaller current transformers that go on the individual circuits you’ll monitor.
I got the Vue package with eight circuit CTs, but you can also get zero or sixteen and install as many or as few as you want. If you want to monitor more than sixteen circuits, however, you’ll need to buy more Vues.
After you get it all installed, the Emporia app guides you through the setup process to get your circuits labeled properly.
A few early takeaways for my house
Once you get the app set up, it gives you a lot of information. The screenshot above shows the home screen. When you want the details about any of the circuits you’re monitoring, you just tap on the name. I’ll take you through some of my circuits and show you my early whole-house electricity monitoring takeaways.
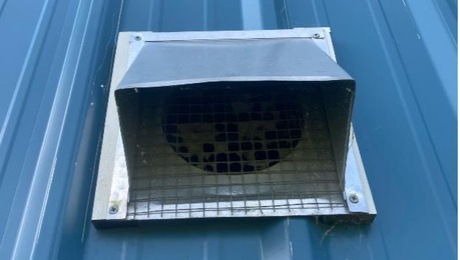
Attic fan
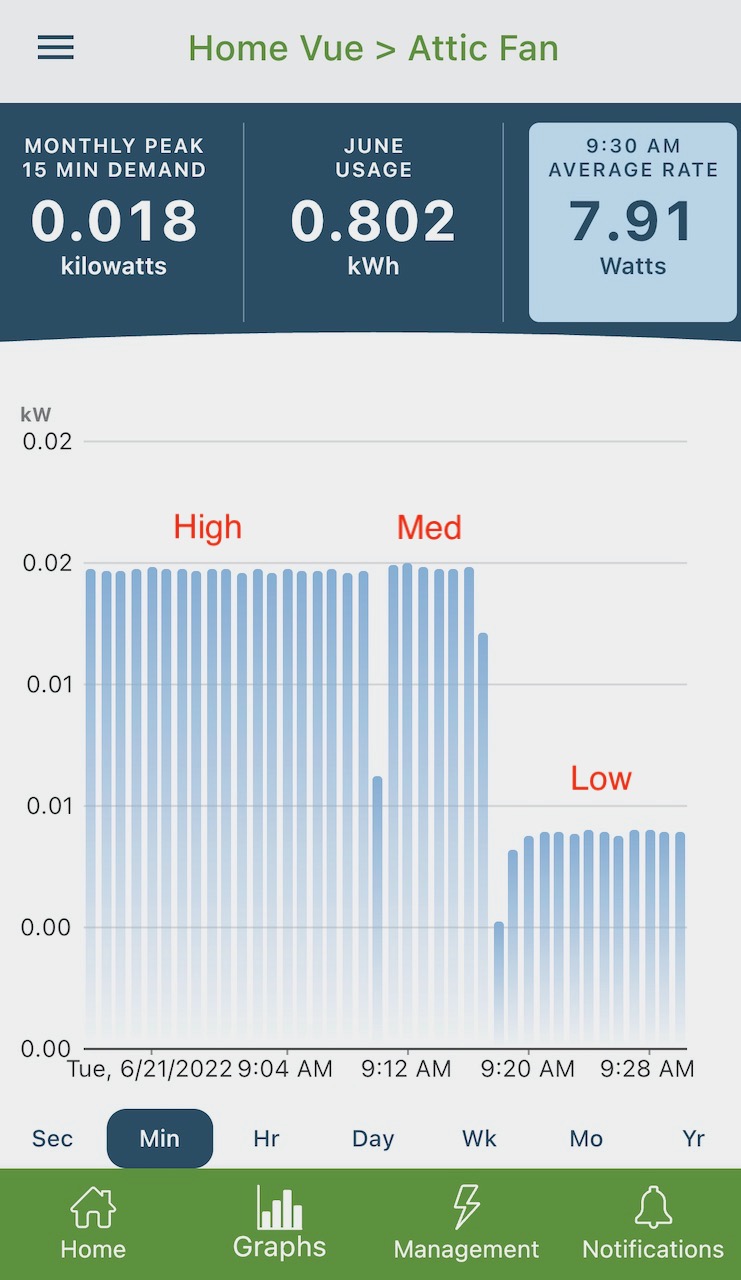
Above is the screenshot for the exhaust fan I use in my spray foam encapsulated attic. (Read my article on why I use such an attic fan to learn more.) It’s a Panasonic FV-0511VQ1 WhisperCeiling fan with three air flow rates: 50, 80, and 110 cubic feet per minute. The Vue showed me that the high and medium speeds use exactly the same amount of power: 17 W. Low speed draws only 8 W. Now I need to get back in the attic and measure the air flow to find out what’s going on with that.
Ducted minisplit heat pump
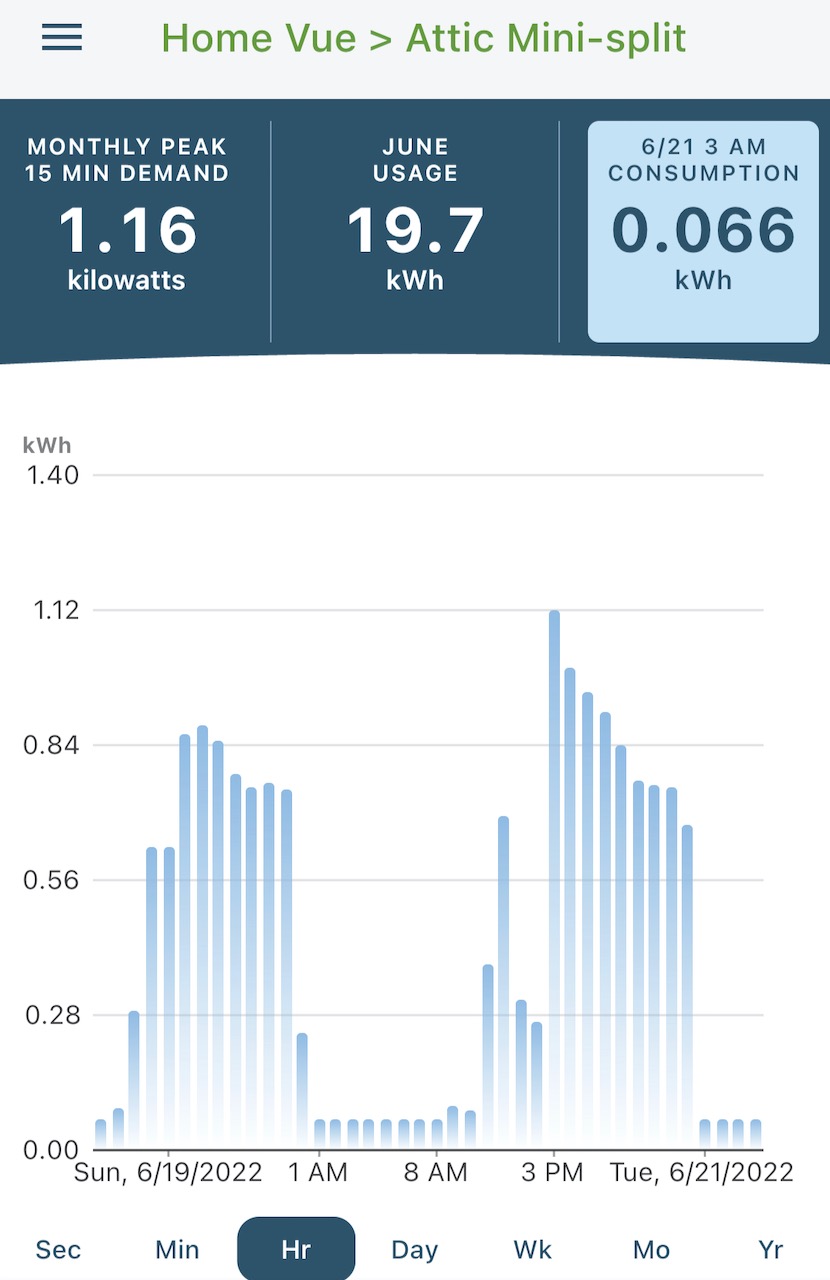
My 2 ton Mitsubishi minisplit heat pump with two ducted air handlers is working as expected. You can see the power usage changing throughout the day over a two-day period. It ramps up to higher power as the cooling load on the house increases. That indicates the heat pump is operating at a higher capacity. Ah, variable capacity!
Another thing you can see is the range of power use. The highest I’ve seen so far is about 1,200 W. You can’t see it in the graph above, though, because it didn’t stay at 1,200 W for a full hour. On the low end, the unit uses about 65 W of power when it’s just moving air through the two air handlers and ducts.
Heat pump water heater
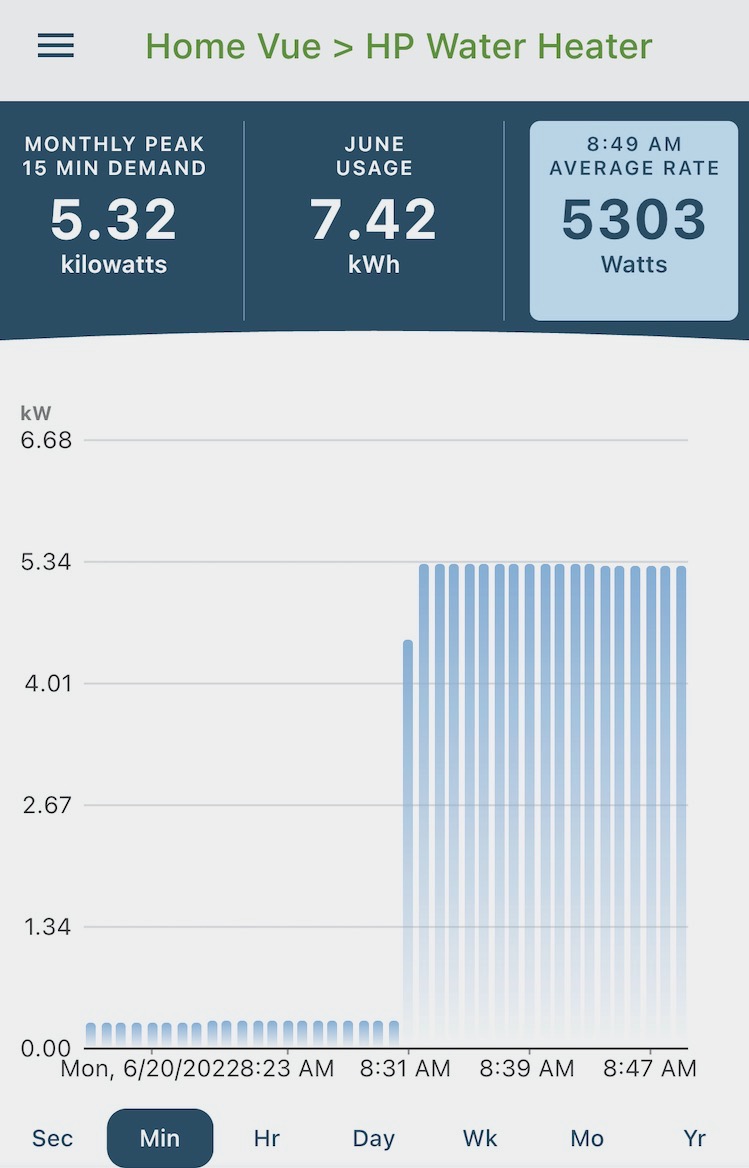
Of course I also wanted to measure the energy use of my heat pump water heater. And for the very first time, I turned on the resistance heat to see the difference. The graph above shows it in heat pump only mode at first, using about 300 W of power. Then I switched on the strip heat and it added 5,000 W. Wow! I definitely don’t want to leave it in hybrid mode, or what Rheem calls “energy saver” mode.
I also checked to see what kind of agreement I had between my Vue readings and the Rheem app. The Vue measured 6.76 kWh for the whole day yesterday. The Rheem app told me I had used 6.81 kWh. That’s pretty darn good. Unless Rheem has fixed their app, though, I don’t expect to see that close agreement all the time.
Electric vehicle (EV) charging
Shortly after I got everything set up, I took a 31 mile trip in my 2014 Nissan Leaf. The electricity I used for the trip was 9 kWh. At $0.13 per kWh, that trip cost me $0.04 per mile. Our gasoline prices in Atlanta right now are about $4.20 per gallon. A 25 mile per gallon vehicle would cost about $0.17 per mile to drive, quadruple the cost of driving my EV.
More about Emporia
The Emporia Vue does more than just monitor your total and circuit energy use. It also can monitor your solar energy production from photovoltaic modules. With the energy use data, you’ll then know if your net-zero-energy house really is net zero. The Vue also integrates with smart thermostats, home battery systems, EV chargers, and smart plugs to let you automate things like EV charging and lighting cycles. If you have time-of-use electricity rates, that can save you some money by letting you charge your EV or run the dryer at off-peak times.
In addition to the Vue, Emporia also sells smart plugs. I’ve been using a bunch of them for more than a year now. They make it really easy to turn lamps and other plug loads on and off on a schedule or remotely. That’s how I measured energy for my room dehumidifier efficiency article last year. They’ve also got a neat level 2 EV charger as well as a bi-directional charger and a home battery system coming soon.
Let the fun begin!
Now that I’ve got my Emporia Vue set up, I’m going to have so much fun! I look forward to doing lots of interesting experiments. For example, I can see if there’s any difference between the power use in my ducted minisplit with clean and dirty filters. I’m also going to monitor my total load to see how close I get to maxing out our 200 amp service. And I’m really hoping to find out what the heck that mystery load is. It’s on a double-pole 30 amp breaker, and I’m hoping it’s a long-abandoned load. If so, that’ll free up two slots in my full electrical panel.
As I make my way toward having a net-zero-energy home, this kind of monitoring is really important. And then after I add photovoltaics to my roof, the Emporia Vue will verify when I actually do get net-zero performance.
_________________________________________________________________________
Allison A. Bailes III, PhD is a speaker, writer, building science consultant, and the founder of Energy Vanguard in Decatur, Georgia. He has a doctorate in physics and writes the Energy Vanguard Blog. He also has a book on building science coming out in October 2022. You can follow him on Twitter at @EnergyVanguard. Photos courtesy of author.
Weekly Newsletter
Get building science and energy efficiency advice, plus special offers, in your inbox.


10 Comments
My frustration with the using a Sense, is that it does not have an integration with Accurite (temperature and humidity) or with Insteon(lighting). Hopefully the Vue will go into the IEQ factors that drive energy use.
I love my Vue. I can't claim it saves me money, but it's great at satisfying my curiosity. I can see the buildup of frost on my heat pump, the impact of solar heat gain in winter, who uses more hot water in the shower, whether the oven is on after I left the house, etc. Once, my heat pump locked out due to low refrigerant pressure, and I could see the buildup of frost that preceded it on a cold rainy night.
Thanks for this article on whole home energy monitoring. Very informative! I am an energy advisor and working with a landowner in BC who is also doing whole house energy monitoring. They recently built a high performance home in the BC Energy Step Code 5 realm. We considered the Emporia Vue energy monitor but decided to go with the Sense AI energy monitor (with solar bundle) because we wanted more than 16 circuits of monitoring capability. We have completed the first year of monitoring with the Sense unit. We have the first blog article out which focuses on how to use it and some preliminary outcomes. Those interested can go to the blog article here: https://www.fluentenergy.ca/post/your-title-what-s-your-blog-about
One good reason to install a monitor like this is to monitor the maximum current being consumed in order to help assess whether future electrification steps (natural gas -> heat pump or other electric appliances, and electric vehicles) are going to require a service upgrade or load management system. For that purpose, under NEC 220.87, one would want the 15-minute peak current (not power). I see that it displays the monthly 15 min peak power, which is great, and from app screenshots I've seen, it looks like you can switch to displaying current (in amps). In that mode, does it give you the 15 min peak data too? Can you do that over different time periods? The code requirement is for a 30 day study with manual correction for weather, or a full year's data used directly.
I've done that with my Iotawatt system, which tells me that I have lots of spare capacity, despite powering an all-electric house in NH with an EV (32 A charging) all on 100 A service, but it's a bit of a pain to find the 15 minute peaks--it looks like this may be a better choice for getting that data. If so, installing one of these would be a great low-cost first step for people planning to electrify in the next few years.
Intriguing, but I'm not willing to invite some unknown 3rd party to host data about my house and energy usage. Is there a similar device that does not 'phone home' or require internet access?
Iotawatt is an open-source alternative that does not require any third-party hosting. It used your home wifi system to display the data on your computer or phone, but if you wanted to I think you could do that on a link that isn't connected to the internet.
TED (the energy detective) is another to look at--my ancient TED had no internet connectivity at all, but I'm not sure about the modern ones.
I also use Iotawatt because of this.
Brultech Green Energy Monitor (GEM), especially if you are a DIY'er. 32 circuit inputs and a few dry contact inputs. Wifi or hardwired LAN connection. Great technical support before and after the sale. Canadian company, but shipping to US is not that bad. I ordered a second GEM to monitor a subpanel on Sep 9. It shipped yesterday. Tracking shows it will be delivered Sep 20. I live near Houston. Shipping for one GEM, about 20 CT's, and a "DashBox" was $23. They don't require a 3rd party host, but you can use one if you want, or you can keep all the data local (as much as you want). Published API so you can make the data available to home automation systems, data analysis applications, etc.
I have a couple of their older monitors that I kept from a previous home, and wanted to use them in a new home (currently under construction) when ready. They've been sitting on the shelf since 2016, so I needed to make sure they would work, and that they could be integrated with the DashBox and a couple of new GEM's. It would have been easy for them to tell me to throw out the old stuff and buy more new, but they provided a lot of assistance getting the old monitors running (e.g., firmware and software upgrades), and giving me ideas on how to integrate everything.
If it's not obvious, I like those guys and their products a lot. Be forewarned though... their UI is probably not as slick as some of the other products. I'm not familiar with the other monitors, but the Brultech monitors are probably a little more complex to get up and running due to all of the options they have.
I was in the same boat, but recently some enterprising folks have figured out how to flash the Vue with ESPHome firmware for entirely local operation, no cloud required.
It requires some basic soldering to allow for a serial port connection, but otherwise is fairly straightforward.
Details here: https://gist.github.com/flaviut/93a1212c7b165c7674693a45ad52c512
Builders of new residences (and upgraders) may want to consider a smart service panel. GBA link:
https://www.greenbuildingadvisor.com/article/reinventing-the-electric-service-panel
Log in or create an account to post a comment.
Sign up Log in