
More Guest Blogs


Energy burden—the proportion of household income spent on electricity and fuel—is an issue of rising urgency. Increasingly frequent and extreme weather events create life-threatening situations for those that cannot afford power, and the number of households struggling to make energy bill payments is staggering. In 2020, nearly 34 million US households reported reducing or forgoing food or medicine or leaving the home at unsafe temperatures in order to pay their energy bills.
However, new funding from the Inflation Reduction Act (IRA) and targeted state-level policies present opportunities to reduce energy inequity.
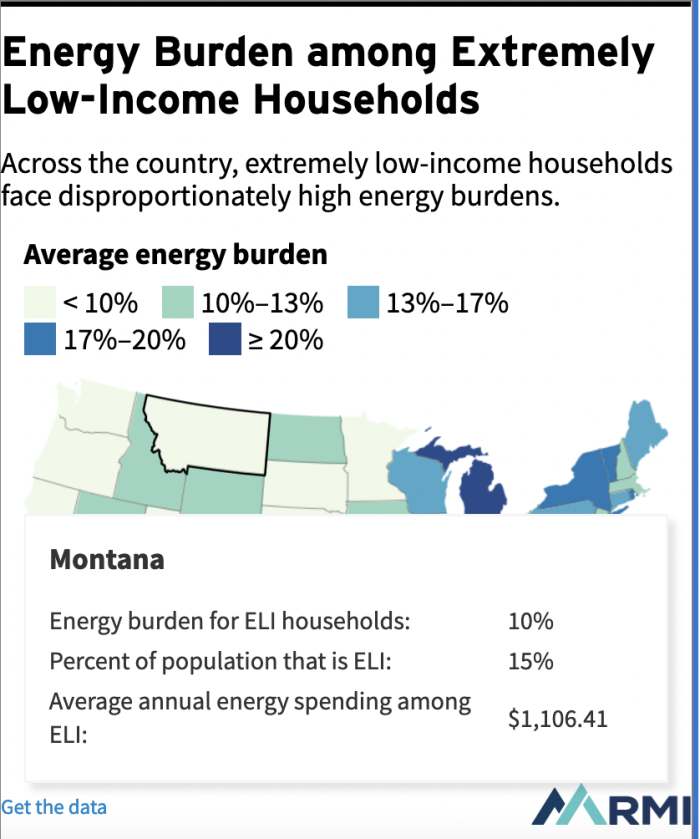
In a new analysis, we calculate energy burden across income groups for all 50 states using up-to-date data from the Energy Information Administration’s Residential Energy Consumption Survey (RECS). We find that extremely low-income households—those earning less than 30 percent of the state median income—bear a disproportionately high energy burden. Approximately one in every seven households has an average energy burden of 14% (the average for non-low-income households is 3%). That is greater than the threshold of 10%, at which a household is considered energy impoverished.*
Fortunately, much can be done to lessen energy burdens nationwide. Several IRA provisions, including the Home Efficiency Rebates and Home Electrification and Appliance Rebates, allocate funding to subnational governments to increase the accessibility and affordability of household electrification and efficiency upgrades. This, in turn, will reduce energy bills for consumers.
Additionally, several states have initiated policies that are making a difference for extremely low-income households. Colorado, for example, has coupled community solar programs with outreach to low-income communities, successfully reducing electricity costs for those that need it most. In California, percentage of income payment plans (PIPPs) ensure that low-income households don’t spend more than 4 percent of income on electricity costs.
The transition to a clean energy economy—the largest infrastructure shift in our lifetimes—is also an opportunity to create a more just energy system. Shifting away from fossil fuels and toward clean and renewable energy sources should reduce the prices all consumers pay to electrify and fuel their homes.
Key IRA incentives
The Inflation Reduction Act (IRA) and the Infrastructure Investment and Jobs Act will save American families approximately $38 billion on electricity bills. The IRA aims to accomplish this by lowering the cost of household technology upgrades, including electric heat pumps and air conditioning systems. Once installed, these technologies can immediately reduce energy consumption and reliance on volatile, fossil-fuel-powered sources of energy. This culminates in lower household energy costs.
Here are a few specific IRA funds targeting low- and middle-income households that state and local governments can apply for:
- Home Electrification and Appliance Rebates allocate funding to state energy offices for helping households electrify their homes. These new point-of-sale rebates are available only to low- or moderate-income households. The sooner states design the programs, the quicker that funding will become available.
- The Home Efficiency Rebate Program incentivizes whole-home retrofits in single-family and multifamily dwelling units. These retrofits promote energy savings through improved efficiency and electrification. Rebate amounts increase as energy savings increase and are doubled for low-income households.
- The Greenhouse Gas Reduction Fund will make grants to nonprofit financial institutions, states, and Tribes to drive low-cost financing for climate and clean-energy projects, especially in disadvantaged communities. The $27 billion fund could mobilize more than $250 billion over 10 years to decarbonize homes and small businesses. It sets aside $7 billion for Solar-for-All, a program to expand existing or support new low-income solar programs nationwide. Depending on how funds are awarded, the programs may serve more than 1 million low-income Americans across every state and territory in the US.
Importantly, the IRA can lower the price that consumers pay for electricity and fuel in households that already have electrified or are not able to electrify. The IRA will reduce overall demand for volatile, fossil fuel-powered energy sources, driving down the prices that all households pay for utilities.
Beyond the IRA
Our research surfaced additional state-level efforts to alleviate energy poverty. Promising programs and policies include:
- Energy Affordability Goals. Statewide energy affordability targets reinforce the importance of ensuring all households can pay for electricity and fuel without foregoing other basic living expenses. But few states have formalized such goals. A notable exception is New York, which in 2016 set a statewide goal of capping household energy burdens at 6 percent. Michigan has not yet taken the same step, but the state’s Healthy Climate Plan acknowledges the importance of addressing energy burdens.
- Energy Assistance Programs. The federal government’s Low-Income Home Energy Assistance Program (LIHEAP) helps families in need with their energy bills. However, in all states, there are significant numbers of families that are eligible for LIHEAP but are not accessing those funds. Additionally, federal funding for LIHEAP can vary from year to year. States can fill in this gap by augmenting federal funding with energy assistance programs like percentage of income payment plans (PIPP). In some states, low-income customers can register for PIPPs and agree to pay a set percentage of their income toward utility bills in exchange for discounts. For example, California initiated a PIPP pilot program in 2021, which allowed utility customers below the federal poverty line to cap energy payments at 4 percent of household income. This program reduces both energy burden and disconnection risk for extremely low-income households.
- Energy Efficiency Upgrades for Low-Income Households. Energy efficiency upgrades renovate homes so that they consume less energy, resulting in lower bills. To extend energy efficiency benefits, several states have enacted policies requiring utilities to spend a certain portion of energy efficiency funding on programs targeting low-income households. States can broaden the reach of these programs by partnering with community organizations and offering multilingual communications.
- Community Solar with Low-Income Outreach. States can effectively reduce energy burden by coupling community solar, consisting of mid-size solar arrays connected to the distribution grid, with mandates for low-income community outreach and connection. In 2015, Colorado’s Low-Income Community Solar Demonstration Project universally saved households between 15 and 50 percent on their electricity bills. The project involved building out six community solar models with seven utility partners, who each agreed to provide solar credits to low-income subscribers. Today, other states including Connecticut, Hawaii, Maryland, Nevada, and Oregon are working to ensure that low-income households financially benefit from community solar by setting minimum levels of low- and moderate-income subscribers.
- Moratorium on Electricity and Gas Shutoffs. No household should have to experience a loss of electricity or gas, or face trade-offs between feeding the family and paying the energy bills. Though this is not a solution to energy poverty, a moratorium on electricity and gas shutoffs is critical to protecting the health, safety, and wellbeing of all households. The practice of utility disconnection due to non-payment can be life-threatening, particularly for children and older adults.
The need for policy innovation and implementation
Across every state, extremely low-income households bear disproportionately high energy burdens. Though calculating energy burden is simple, identifying its driving factors is complex. Aside from energy spending and household income, other drivers of the disproportionate energy burden faced by extremely low-income households include housing characteristics, socioeconomic factors, and environmental phenomena.
Extremely low-income households in southern states had the highest energy burden, spending nearly eight times as much of their total earnings on energy as households earning at or above the state median income. States in the South were among those with the largest Gini coefficients, which is a statistical measure representing income inequality with higher values indicating greater inequality. Additionally, southern states had the highest average Diversity Index, which may be indicative of a greater presence of intergenerational poverty and discrimination.
Conversely, low-income households in western states had the lowest energy burden among extremely low-income households, even though they spent nearly six times as much of their total income on energy as households earning at or above the state median income. States in the West also had the lowest Gini coefficients and the lowest proportion of extremely low-income households.
Reducing emissions while alleviating energy poverty
RMI released its State Scorecards earlier this year, which documented how 20 states are making progress toward emissions reductions consistent with achieving the US Nationally Determined Contribution (NDC) to the Paris Agreement. Most of the states making the greatest strides toward decarbonization also maintain an energy burden among extremely low-income households that is lower than the nationwide average of 14 percent. New York, which is the exception, has the highest Gini coefficient of all states, and, New York City, which houses over 40 percent of the state’s population, has among the highest energy rates in the country.
The results from a comparison of our energy burden analysis against the State Scorecards demonstrate that it is both necessary and feasible for states to lead on climate and ease energy poverty. However, accomplishing each of these goals requires deliberate attention. For example, Colorado and Washington, two states that are making the most progress toward climate targets, have enacted policies that are specific to energy affordability. The Colorado Energy Office conducted a study on energy burden in the state and is using the resulting recommendations to inform policy. Washington’s Clean Energy Transformation Act requires utilities to offer payment assistance to low-income households and demonstrate a reduction in energy burden.
Energy poverty is a function of poverty. It is also an essential challenge of a just transition — one made even more urgent by increasingly frequent extreme weather events. This analysis reinforces the need of all states to deliberately focus on energy burden in addition to reducing economy-wide emissions.
This article originally appeared on RMI on December 18, 2023. It is republished here with their permission. Graphics source: How High Are Household Energy Burdens, ACEEE, and “Community vulnerability is the key determinant of diverse energy burdens in the United States,” Zhenglai Shen, et al.
*We calculated energy burden using data from the 2020 Residential Energy Consumption Surveys (RECS). RECS is administered by the Energy Information Administration to a nationally representative sample of households and collects detailed information on housing energy characteristics. Each of the 18,000 observations included in the RECS database was divided into income groups based on 2020 state median income data. From there, we tabulate energy burden across incomes and geographies by dividing the sum of household energy spending by the sum of household incomes.
In our State Scorecards, we used the state-specific Energy Policy Simulator (EPS) models, an open-source data tool co-developed by Energy Innovation and RMI, to quantify state progress toward NDC-aligned targets. We did this by first partnering with Climate XChange to collect and review every major state climate policy passed before June 2023. We then compared 2030 emissions based on current policy against the state’s emissions in 2005, a common emissions benchmark year for climate targets, and an NDC-aligned scenario based on a policy package that achieves US climate targets.
Weekly Newsletter
Get building science and energy efficiency advice, plus special offers, in your inbox.


3 Comments
This article is very informative, the reality is there is much poverty here in the US. People want and deserve an independent lifestyle but that is increasingly unaffordable for many. I have been involved in the building industry my entire adult life and have watched as building codes have changed very little to promote energy independence. Sat in on the MN Energy Code Task Force meetings in the mid 2000's and saw the ferocity in keeping the status quo by the major builders. Mass change in the current system is unlikely, if you have building experience help a neighbor.
One of the best programs in the U.S. for attacking energy poverty is the DOE’s Weatherization Assistance Program (WAP). All states have a version of this; anyone meeting 200% or less of the federal poverty guidelines can apply (homeowners or renters), and local non-profits run the program with crews or local contractors so it’s people from your area. The process begins with agency staff coming to a client’s home and doing a 2 – 4 hour inspection, part of which includes an energy audit to ensure work will pay for itself in energy savings. A work order is then created and a schedule determined with the client. Insulation and air sealing are two legs of the WAP stool, but the third leg can be anything from repairs to replacing refrigerators, heat pumps, furnaces, water heaters and installing ASHRAE-rated ventilation, carbon monoxide and fire detectors. Daily blower door testing is performed, and a final inspection ensures work meets strict DOE standards.
And all of it is free. The average target cost is $8250 per unit for 2024, and many agencies leverage with other funding sources so additional services can also be performed, such as roof repairs or replacements, or more in-depth renovation work. And with additional BIL funds over the next few years (including multifamily buildings), the demand will only increase. So if you know anyone who might be applicable, or any contractors interested in doing work, contact your state WAP program to find the provider in your area.
Shtrum,
I agree that the Weatherization Assistance Program is a great program. More information here: "Is Weatherization Cost-Effective?"
Log in or create an account to post a comment.
Sign up Log in