
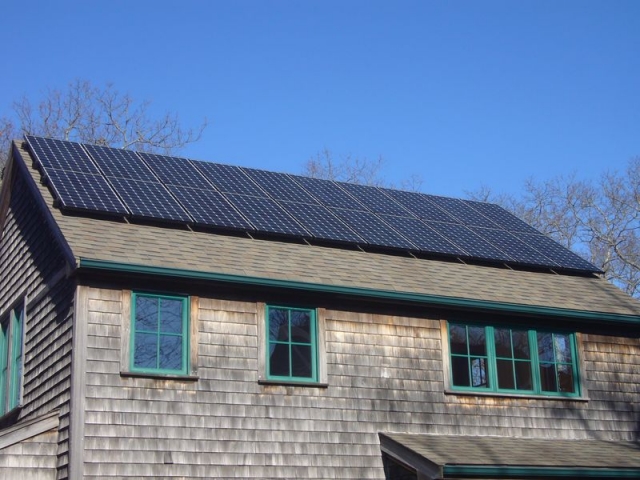
Image Credit: Marc Rosenbaum
More Guest Blogs


One thing I learned while following the energy usage of buildings I designed was that as a building’s energy needs are reduced, and the fraction of those needs supplied by solar energy increases, the variation in backup energy (purchased energy) increases from year to year.
Let’s look at the monitoring data for our house, and compare the winter of 2011-2012 with the winter of 2012-2013. Due to colder weather and changing lifestyles, we used 23% more energy over these months in 2012-2013 than in the previous year.
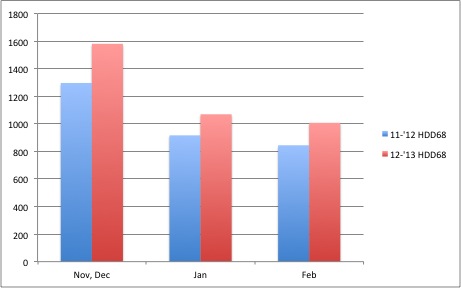
First, we’ll look at the variation in heating load. This winter (November to February) has been 20% colder than last winter.
Degree Days
We’ve used 23% more energy over these months. Here’s how the usage breaks down between the heat pump and all other uses. Note that heat pump energy used is up 32%.
Heat Pump Energy Use
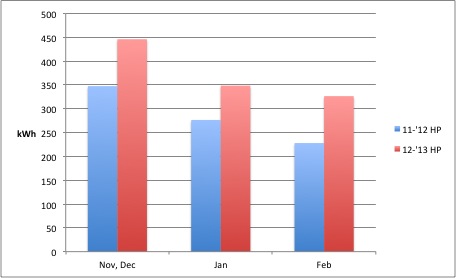
As it gets colder outside, the heat pump efficiency drops, so it makes sense that heat pump energy use goes up faster than heating demand.
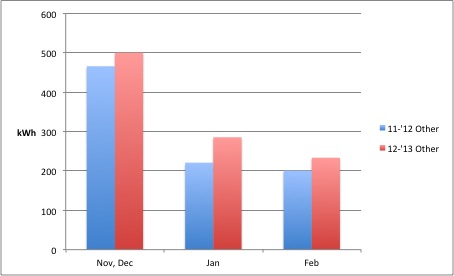
However, another difference in what we use is due to the fact that Jill now works 3/4 time, and is home on Mondays and Fridays, so I’m guessing that the average thermostat setting has gone up a tad, and there are more kWh going to lights, computer, music, etc. All other uses are up 15%, with the biggest bump in January.
Other Energy Use
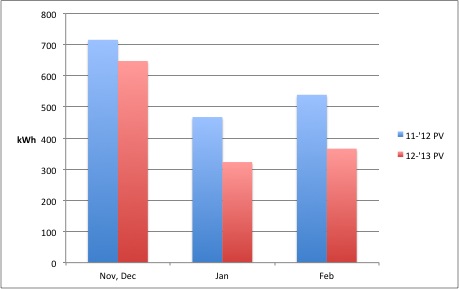
Meanwhile, it’s been noticably cloudier this winter, so PV production over the four-month period is down 22% compared to last year.
PV Production
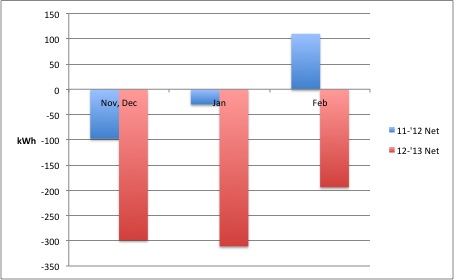
Consequently, while our net imported energy last year over this period was 18 kWh, this year it is 45 times higher at 804 kWh.
Net Imported Energy
Manage client expectations
If you design or build zero-net-energy buildings, it’s important to communicate to the owners that these year-to-year variation are significant. Manage expectations!
Beyond a certain baseline, how much energy they use for plug loads, appliances, and lighting is under their control. How much they use for hot water is similar.
At a given thermostat setting, how much energy they purchase for heating and cooling depends on the weather and the amount of sun available, and how much a solar electric or solar thermal system generates depends on solar availability and how much of the time the collectors are covered with snow.
To reach net-zero during cloudy years, you’ll have to oversize the PV array
If you want to be pretty certain that a building is net zero every year, the solar electric system probably needs to be oversized by close to 30% (a SWAG). Driving the building’s heating load down will make this variation smaller, by making one weather-dependent factor smaller.
Marc Rosenbaum is director of engineering at South Mountain Company on the island of Martha’s Vineyard in Massachusetts. He writes a blog called Thriving on Low Carbon.
Weekly Newsletter
Get building science and energy efficiency advice, plus special offers, in your inbox.


6 Comments
Some thoughts on the financial return from residential PV's
Thanks to Marc for sharing these numbers.
An electrician I know who installs PV's, energy efficient lighting and power optimisation kit asked me if I could give him some advice on how to calculate the financial return from PV's. It's a fascinating problem. Retail customers in Victoria will pay around 25c/kWh for electricity peak rate and around 10c or so offpeak. The production curve for PV's is during the peak tariff period on weekdays. (Weekends are offpeak.) So if a customer's power use is mainly during peak time they will be earning 25c/kWh from PV generation consumed onsite but any PV generation not consumed onsite will be exported to the grid receiving the current feedin tariff of 8c/kWh. It's not difficult to do a Levelised Cost of Energy Calculation (LCOE) for residential PV's. At 7% discount rate (indicative mortgage rate in Oz) and $10k for a 5kW system (still quite a bit cheaper than prices in the US for some reason) over 20 years the LCOE is about 14c/kWh. So the homeowner is doing well if they're replacing consumption and not as well if they're exporting.
But the substitution depends on whether the homeowner is using electricity during periods when the PV is generating. This will depend on a bunch of factors including how many people are in the home during the day as Marc notes, appliances in use and so on. The local electricity retailers are starting to have good consumption pattern data through smart meters but not much available publicly as yet. And as Marc says, the PV generation curve will differ seasonally and even during summer there will be cloudy days.
To some extent, it is possible to shift load around a bit and thus run a rudimentary smart grid by using appliances when the sun is shining. We use our electric mower, chainsaw, dishwasher and washing machine when it's sunny. I recently dried some tomatoes in our electric oven on a sunny day. This isn't a lot different in concept to generations of householders who have washed clothes on sunny days to take advantage of early solar powered technology AKA the clothesline. We had a contractor around yesterday to do an audit of the house for the Great Draughtproofing Retrofit Project. He mentioned a friend of his who has downsized his joinery business to work at home, plonked 5kW on his roof and now homepowers much of his gear on sunny days.
A small amount of storage helps enormously with increasing onsite utilisation of residential PV production. Some of the newer battery technologies are decreasing in price and take a lot less maintenance than lead acid batteries. Computer server sites, mobile appliances and EV's are helping drive these technologies. Once EV's are more common and reach the end of their lives there will be a stream of second-hand battery packs available with some life left that may be a cheap source of home electricity storage.
David
Interesting interactions
22% is a heavy hit on PV production. Are there databases of historic sunlight insolation similar to degree day data?
While I certainly understand the impact that someone working at home has on plug loads, I would have expected some of that to more offset the increased heating load occasioned by more heating degree days...perhaps the thermostat setpoint increases are more than a "tad"
PV financial returns in New York State
I've have a solar PV lease on my desk ready to sign. I am glad to hear that my working from home will mean more efficient use of our system.
Being a numbers person I ran an excel model assuming only the guaranteed minimum production on a 7.35 kW system for our new house and energy rates staying the same for the next 20 years. New York passed a $5,000 tax credit for solar leases last year. Basically the state will be paying my lease payments for the first five years. I calculated a NPV (net present value) of $4,273. The lease is a great way to get PV because there is no upfront cost (a big deal when you are building a new home). They do all the paper work, maintain the system, insure it, repair it and provide monitoring. I can't see a downside. My lease is with SolarCity, a national firm, but most of the PV companies in New York are now putting together lease packages.
PV financial returns.
I believe SolarCity has published their contract terms on their website for for review. I would read it carefully and if you are not a lawyer - make sure you have it reviewed. A solar PV lease is a LONG term lease, it's like buying a house.
The solar leasing companies are in theory out to make money - so keep that in mind. The great offer you are seeing is also a money maker for them (and it needs to be - if they are going to be your service provider for years to come!)
One of the things you need to think about -- are the electric rates going to be going up, staying the same or going down. Of course, if I knew that answer for sure --- I would be quite wealthy; however you can't automatically assume that because you've had rate increases for seven of the last seven years -- that the next seven will also have rate increases. Nor can you predict the with a great deal of accuracy the utility rates of the future.
Part of the reason why the prediction now and into the future is so merky, is that with the success of the shale gas production - there has been significant downward pressure on energy costs. Some of that may pass on to the consumers. In addition as more and more renewables are being deployed - the cost of energy from "green" producers is also dropping.
SolarCity or any company that you work with should be able to give you a pretty good estimate of what rebates you would get if you install it yourself, if they install it -- presumably that get the rebates, the renewable energy credits, and the federal investment tax credit. Make sure that you understand who is able to claim the various credits. My guess is that SolarCity will own them.
RE:Big Variations in Annual Energy Use
I also capture and log enormous amounts of data on our house, the solar pv performance and our usage trends.
When I look at the charts, I can easily spot the days that my wife and I are out of the house attending meetings elsewhere. It is true - attending conferences will save you money :-) .... When I've gone back and tried to understand why - it turns out the simple things, like brewing another pot of coffee, using the microwave, going into the refrigerator more frequently, opening the door when someone knocks all add up. For us we see typically a two to four kWh/day difference.
Add in the use of the computer at home, printing, etc and you could certainly increase your energy use by 15%. But then you need to remind yourself, that by being home two days a week - you may also be offsetting energy used for traveling to and from work. It might be that if you include the savings from transportation on two days a week that the overall net is closer to zero.
PV production down
Curt, 22% seems like a lot, but we also have to remember that weather data is typically a thirty year average.... sort of. The process used by the "data masters" is pretty fancy... they look at the thirty years of data, try to determine the MOST typical month pattern, then select that month to build the (daily) profiles. So if you look at the "Average" profile for a year it really is a composite of the most probable weather/solar patterns each month.. That means you might have a January's data from 1996, a July's data from 2005, September could be based on 1986,... etc.
The 2012 weather that Marc is experiencing -- might just be some of the "extreme" months that would be toss out of the models. Or in thirty years it could be the normal.
The first year that we installed the solar on our house - the numbers looked great and I was really tempted to view that as the typical year. Then the next year went by... and the my dreams of every year being far better than the design were dashed. (We had one day mid June with only 1.5kWh production, it should have been 40kWh!) Last year was much closer to what I had expected from the design. This year we are running perhaps a 2% or 3% better than last year.
I am in the bright and sunny Northwest, Marc I believe is in the dreary and always rainy Northeast :-)
Log in or create an account to post a comment.
Sign up Log in