
Image Credit: Courtesy Bill Steen (http://www.caneloproject.com)
Although there is a lot of interest in green finish materials, they don’t tend to come up often in the context of building energy performance. However, they do have the potential to influence energy performance in the following ways.
- The color and reflectivity of interior surfaces affect the amount of lighting power needed for indoor tasks; waste heat from lighting then contributes to cooling loads. There is an excellent discussion of these relationships in The Integrative Design Guide to Green Building, by 7Group and Bill Reed.
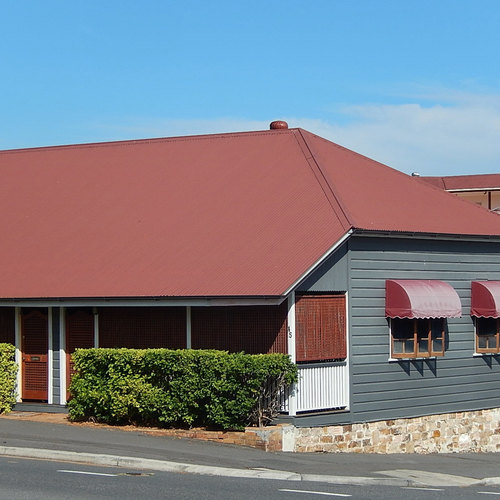
- The color and reflectivity of exterior surfaces can affect the amount of solar radiation absorbed and subsequently converted to heat inside the building; in hot climates, “cool roofs” can be particularly important. (See Richard Defendorf’s July 30 blog post on this.)
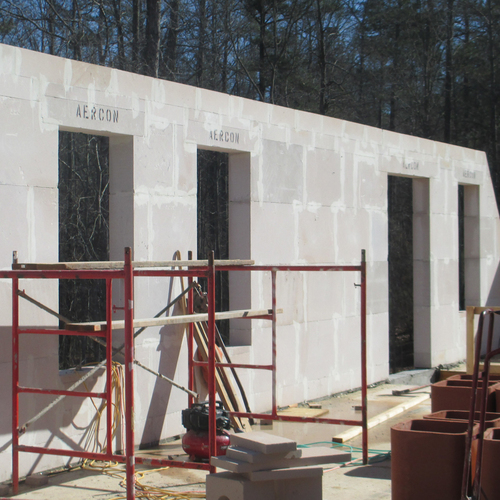
- Sheetrock and hard floorings (e.g., concrete, stone, tile) provide thermal mass—the capacity of a material to store heat—which can help modulate interior temperatures. Climates that see large diurnal temperature swings benefit the most from thermal mass; during the day, it absorbs heat, which is then reradiated at night when the house cools down.
- Lime and earthen plasters may help ease cooling loads by reducing humidity. These materials can attract and hold moisture vapor from humid air and then rerelease it to the air in dryer periods. While scientific proof has yet to be produced, according to natural building expert and GBA advisor Bruce King, anecdotal evidence is too strong to disregard.
Weekly Newsletter
Get building science and energy efficiency advice, plus special offers, in your inbox.





5 Comments
FSEC research on reflectivity and energy use
Nice post Ann. The problem of course is to quantify the savings potential of these strategies, in the same way that we can quantify savings from insulation products. Check out this brief report from the Florida Solar Energy Center. They monitored cooling loads during the summer and then switched the exterior paint color to a more highly reflective color. The load was reduced by about 10.5%, when normalized for weather/temp patterns. Not bad, eh?
oops, the link
Of course, I didn't include the link to this study.
Here it is: http://baihp.org/media/pdf/ReflectiveWalls_DParker.pdf
the FSEC report
Thanks, Brennan - love getting the data!
FSEC study interpretation
There are a couple of key points about this "data". First, the FSEC study does not claim that houses will save anywhere near 10% of their cooling load by changing the exterior paint color. Their analysis was for a small test hut where a much larger fraction of the cooling load was solar gain through walls than would be for a conventional home. The difference in construction should magnify the impact of wall color by perhaps 2x, implying maybe a 5% difference. Second, the FSEC analysis did not account for differences in solar gain between the pre and post conditions -- it only adjust for temperature. The solar gain was larger in the pre-treatment period (longer days in June and early July). Correcting for this difference might reduce the impacts in half again. So the net result might be a 2%-3% reduction in cooling loads from a shift to reflective wall paint.
Detailed evaluation of the experimental results at FSEC
We did another analysis for Hashem Akbari where we did correct for the difference in the solar irradiance in the two periods which were measured.
The key point is that the savings go down to 8% and not to 2-3%. While the ratio of wall to volume is unusual for the small buildings, the overall result for a real house would be closer to 5% than to 2-3%. So the effect is not so small.
Evidence and statistics:
We did measure horizontal irradiance which was 224 W/m2 ( over the pre-period and 188 W/m2 over the post period.
Given that difference, I just re-ran the regressions with daily average solar irradiance as a term to correct for that variation in the pre/post period.
. reg cacpwr cDT solari if wallwht==0
Source | SS df MS Number of obs = 60
-------------+------------------------------ F( 2, 57) = 213.24
Model | 23.4671642 2 11.7335821 Prob > F = 0.0000
Residual | 3.13640237 57 .055024603 R-squared = 0.8821
-------------+------------------------------ Adj R-squared = 0.8780
Total | 26.6035666 59 .450907908 Root MSE = .23457
------------------------------------------------------------------------------
cacpwr | Coef. Std. Err. t P>|t| [95% Conf. Interval]
-------------+----------------------------------------------------------------
cDT | .2646276 .0144959 18.26 0.000 .2356 .2936551
solari | .0016805 .000524 3.21 0.002 .0006313 .0027297
_cons | 2.572886 .1223351 21.03 0.000 2.327915 2.817858
------------------------------------------------------------------------------
. reg cacpwr cDT solari if wallwht==1
Source | SS df MS Number of obs = 105
-------------+------------------------------ F( 2, 102) = 428.77
Model | 50.148988 2 25.074494 Prob > F = 0.0000
Residual | 5.9649151 102 .05847956 R-squared = 0.8937
-------------+------------------------------ Adj R-squared = 0.8916
Total | 56.1139031 104 .53955676 Root MSE = .24183
------------------------------------------------------------------------------
cacpwr | Coef. Std. Err. t P>|t| [95% Conf. Interval]
-------------+----------------------------------------------------------------
cDT | .2403982 .0101873 23.60 0.000 .2201917 .2606047
solari | .001968 .000455 4.33 0.000 .0010654 .0028705
_cons | 2.247493 .0822252 27.33 0.000 2.0844 2.410586
------------------------------------------------------------------------------
The average values for cDT (indoor to outdoor temperature difference) was about 1.3 F over the period. The average hourly horizontal irradiance (solari) was 203 W/m2.
Evaluating both regressions given these terms gives the following for cacpwr (control AC kWh).
Pre-period (tan walls) = 3.25 kWh/day
Post period (white walls) = 2.96 kWh/day
The difference is now 8.9% vs. the 11.6% I previously showed without normalizing for daily average irradiance. Thanks for catching that. R2 is up too.Now, the simulation and the experiment agree exactly-- likely a coincidental result, but nice nonetheless.
Not surprisingly, there appears to be strong collinearity between the solar irradiance and dT terms. I don't show it here, but when I enter an interacted term (cDT * solari) in a regression I get a much higher value for the interacted term for the darker walls. The physical interpretation of that is that when the outdoor temperature is high the solar absorptance is much more important to cooling than when the outdoor temperature may be lower than the interior set point. Makes sense, much more of the collected radiation on the wall will flow inward in the case of higher temperatures.
dp
Log in or create an account to post a comment.
Sign up Log in